Forecast demand, build capacity models from load tests, find breaking points, configure and pre-scale autoscaling, account for downstream limits and quotas, plan capacity for failures, add load shedding, and run capacity reviews
Capacity is the maximum load a system can handle while meeting its SLOs. Capacity planning forecasts demand, measures what each component can sustain, and ensures enough resources — plus headroom and failure tolerance — are available before peaks arrive, with graceful behaviour if forecasts are exceeded.
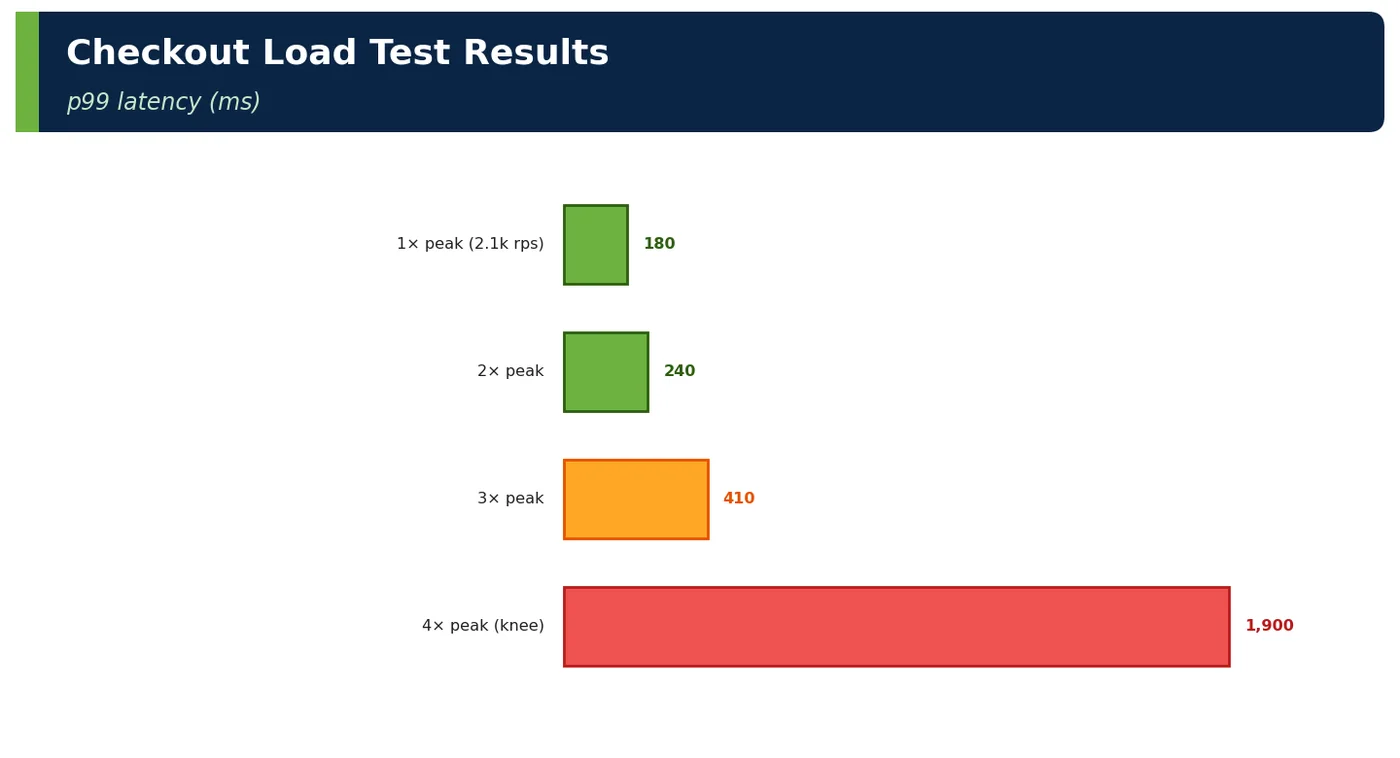
Figure 1 — Checkout load test results
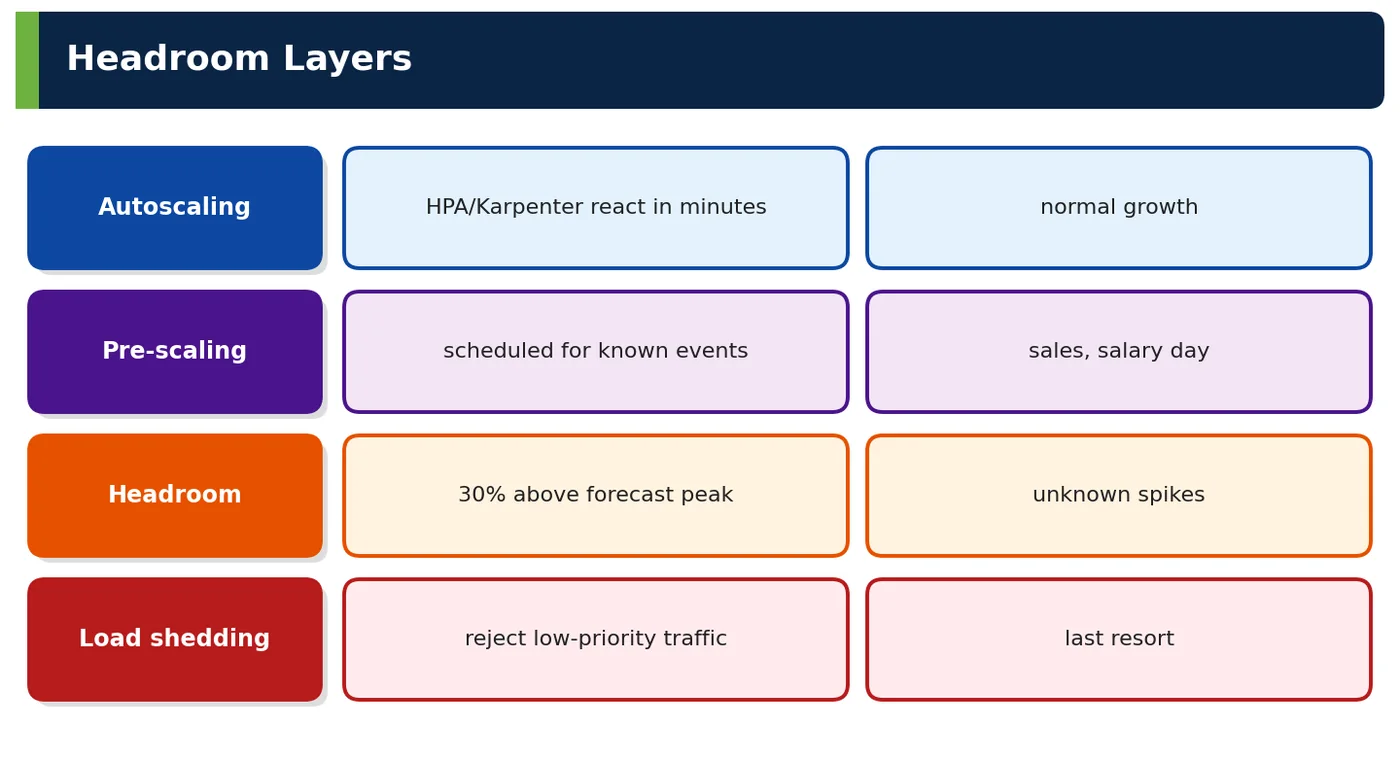
Figure 2 — Capacity model (checkout)
Vocabulary
Meaning
Headroom
Spare capacity above expected peak
Saturation
How full a resource is
Knee
Load point where latency degrades rapidly
Load shedding
Deliberately rejecting some work to protect the rest
Table 1 — Terms
2Why It Exists
Capacity failure
Consequence
Traffic exceeds DB connections
Checkout errors
Autoscaling too slow for spike
Minutes of degradation
Partner rate limit hit
Payment failures
AWS quota reached
Cannot scale
Table 2 — Why
3Core Concepts — Capacity
Load test type
Question answered
Load
Does it meet SLOs at expected peak?
Stress / breakpoint
Where does it break and how?
Spike
How does it cope with sudden 5× jumps?
Soak (8–24 h)
Leaks, slow degradation?
Failover under load
Capacity after losing an AZ?
Table 3 — Test types
Little's law
Application
Concurrency = throughput × latency
2,100 rps × 0.15 s = 315 concurrent requests
Thread/connection sizing
Pools sized from concurrency, not guesses
Table 4 — Queueing basics
4How It Works Internally — Building a Capacity Model
Step
Detail
Forecast
Business events, growth trends, marketing plans
Workload model
Endpoint mix, payload sizes, cache hit ratios from production
# Pre-scaling for a sale via a scheduled KEDA cron trigger alongside CPUapiVersion: keda.sh/v1alpha1kind: ScaledObjectmetadata: { name: checkout, namespace: checkout }spec: scaleTargetRef: { apiVersion: argoproj.io/v1alpha1, kind: Rollout, name: checkout } minReplicaCount: 17 maxReplicaCount: 90 triggers: - type: cron metadata: { timezone: Asia/Kolkata, start: "0 17 6 11 *", end: "0 2 9 11 *", desiredReplicas: "69" } - type: cpu metricType: Utilization metadata: { value: "60" }
JAVA
// Load shedding: reject low-priority work when the service is saturated@Componentclass PriorityShedder implements HandlerInterceptor {privatefinal Semaphore permits = new Semaphore(400); // from Little's law sizing@Overridepublic boolean preHandle(HttpServletRequest req, HttpServletResponse res, Object h) { boolean lowPriority = "recommendations".equals(req.getHeader("x-priority-class"));if (lowPriority && permits.availablePermits() < 40) { res.setStatus(503); res.setHeader("Retry-After", "5"); returnfalse; }returntrue; }}
6Practical Examples
6.1 Connection storm found in load test
At 2.5× peak, checkout pods scaled to 80 and opened 1,600 DB connections, exhausting Aurora. RDS Proxy and smaller pools were added before the sale.
6.2 Autoscaling lag during flash sale
A 10× spike in 30 seconds outpaced HPA and Karpenter; p99 hit 2 s for 3 minutes. Now flash sales trigger pre-scaling and placeholder pods keep warm node capacity.
6.3 Soak test found a leak
A 12-hour soak revealed heap growth from an unbounded cache; a size limit fixed it before it caused weekly restarts.
6.4 Worked example — per-pod capacity
Measure
Value
Max rps at p99 < 300 ms
120
CPU at that load
1.6 cores
Table 10 — Unit of capacity
6.5 Worked example — forecast inputs
Input
Source
Last year's peak × growth
Analytics
Marketing push notifications schedule
Marketing
Table 11 — Business drives capacity
6.6 Worked example — capacity review agenda
Topic
Owner
Forecasts, test results, limits, quotas, costs
Teams + SRE + finance
Table 12 — Quarterly and before events
6.7 Worked example — interview whiteboard
Prompt
Answer outline
"How do you ensure capacity for a 3× sales peak?"
"Forecast with business; model workload from production mix; single-pod tests for unit capacity; scale tests to find shared bottlenecks and the knee; plan pods/nodes/DB with 30% headroom and AZ-loss tolerance; check downstream limits (DB connections via proxy, partner rate limits, cache, partitions) and AWS quotas; pre-scale before the event, placeholder pods for fast node capacity; load shedding and degradation beyond plan; soak and spike tests; review results and cost."
Table 13 — Structured answer
6.8 Worked example — PayGrid capacity per cell
Cell capacity
Value
Authorisations per cell
2,500 tps at p99 < 150 ms
Add cells when > 60% utilised
Scale by cells
Table 14 — Cell-based capacity
6.9 Worked example — anti-patterns
Anti-pattern
Effect
Testing with uniform synthetic requests
Unrealistic results
Ignoring downstream limits
Surprise failures
Relying only on autoscaling
Spike lag
No breakpoint knowledge
Unknown margin
Table 15 — Common mistakes
6.10 Worked example — spike test
Profile
Result
0 → 5× in 30 s
Shedding kept checkout p99 < 800 ms
Table 16 — Behaviour under surprise
6.11 Worked example — cost trade-off
Option
Monthly cost
Always provisioned for peak
₹48 L
Autoscale + pre-scale for events
₹21 L
Table 17 — Elasticity saves money
6.12 Worked example — quota management
Quota
Process
Service Quotas monitoring + alarms at 80%
Request increases early
Table 18 — Quotas are capacity
6.13 Worked example — cache warm-up
Event
Action
Pre-sale
Warm product and price caches
Table 19 — Cold caches reduce capacity
6.14 Worked example — capacity dashboards
Panel
Metric
Utilisation vs capacity per service
rps / max rps
Table 20 — Visible margin
6.15 Worked example — Little's law sizing
Input
Result
300 rps/pod target × 0.2 s
60 concurrent → Tomcat/virtual threads fine; DB pool 20 with queueing
Table 21 — Size pools deliberately
6.16 Worked example — interview follow-ups
Follow-up
Answer
"Why not just autoscale?"
Lag, downstream limits and quotas
"How much headroom?"
30%+ above forecast plus AZ-loss tolerance
Table 22 — Common probes
6.17 Worked example — checklist
Item
✔
Forecast
✔
Realistic load tests incl. breakpoint
✔
Downstream limits and quotas
✔
Autoscaling + pre-scaling
✔
Failure capacity
✔
Load shedding
✔
Table 23 — Capacity baseline
6.18 Worked example — virtual threads and capacity
Effect
Watch-out
More concurrent requests per pod
Downstream pools become bottleneck
Table 24 — Move the bottleneck consciously
6.19 Worked example — batch capacity
Job
Plan
EOD reports
Run outside peak; throttle DB reads
Table 25 — Background work competes for capacity
6.20 Worked example — capacity alerts
Alert
Threshold
Forecast breach (traffic > 80% of plan)
Notify SRE
Table 26 — Early warning
6.21 Worked example — interview scenario
Question
Answer
"Load test passed but prod fell over"
Check workload realism, data volumes, caches, downstream limits, test environment parity
Table 27 — Test fidelity
6.22 Worked example — test environment
Env
Detail
staging-perf (ephemeral, prod-sized for 1 day)
Realistic without permanent cost
Table 28 — Cost-aware fidelity
6.23 Worked example — breakpoint failure modes
Load
Symptom
Component
3× peak
p99 410 ms
CPU saturation (scales)
4× peak
p99 1.9 s, errors 2%
Inventory DB lock contention
Table 29 — Knowing *how* it breaks guides fixes
6.24 Worked example — capacity agreement with dependencies
Consumer
Provider
Agreed peak
checkout
inventory
8,000 rps
checkout
payments
9,000 rps (sale week)
Table 30 — Capacity contracts between teams
6.25 Worked example — post-event review
Metric
Plan
Actual
Peak rps
6,300
5,900
Max pods
69–90
74
Cost
₹3.1 L extra
₹2.7 L
Table 31 — Improve next forecast
6.26 Worked example — data growth capacity
Store
Growth
Plan
orders table
40 GB/month
Partitioning by month, archive after 2 years
Table 32 — Capacity includes storage
7Common Problems & Mistakes
Mistake
Fix
Unrealistic tests
Production mix
Hidden bottlenecks
Scale tests
Scaling lag
Pre-scaling
No overload plan
Shedding
Table 33 — Mistakes and fixes
Load tests mislead in quieter ways too. A staging database with a tenth of production's data keeps indexes in memory and hides slow queries. Generators that repeat the same few product IDs make caches look far more effective than they are. Closed-model tools, where each virtual user waits for a response before sending the next request, slow down as the system slows and hide the queueing that real users create; this coordinated omission is why ShopNow uses k6's arrival-rate executors. The generator itself can saturate, so watch its CPU and network. Teams also report averages instead of p99, size headroom from hourly averages rather than the peak minute, and forget that client retries multiply load exactly when the system is struggling, so an overload test must include realistic retry behaviour.
8Performance & Production Considerations
Consideration
Practice
Monitor utilisation vs capacity
Dashboards
Regular tests
Before events, quarterly
Cost
Elastic capacity
Table 34 — Operating capacity
Day to day, capacity is a set of signals, not a yearly spreadsheet. Each service dashboard shows current rps against measured maximum rps per pod and in total, plus saturation signals that move before latency does: CPU, connection pool wait time, thread or virtual-thread backlog, queue depth and consumer lag. Alert when traffic passes 80% of planned capacity and when Service Quotas pass 80%. Per-pod capacity changes with every release, JDK upgrade or framework upgrade, so a short performance test in the pipeline re-baselines it and catches regressions early. Buy capacity in layers: Savings Plans for the steady baseline, Spot for elastic stateless work, and On-Demand Capacity Reservations for critical event days. Client retry budgets and circuit breakers keep a slow dependency from turning into a capacity incident.
9Architecture & Design Considerations
Guideline
Detail
Design for horizontal scale
Stateless services
Protect shared resources
Proxies, pools
Graceful overload
Priority shedding
Table 35 — Design guidance
10Interview Questions & Answers
Q1BasicConcept
What is capacity planning?
Capacity planning is the practice of ensuring a system can handle expected demand while still meeting its SLOs, before that demand arrives. It has four parts. Forecast demand with the business, including growth, campaigns and events such as Diwali. Measure capacity, per pod and at scale, through realistic load tests up to the breaking point. Plan resources with headroom and failure tolerance, including downstream limits such as database connections, partner rate limits and AWS quotas. Then define what happens beyond the plan, through autoscaling, pre-scaling and load shedding. It is a continuous cycle, revisited quarterly and before every major event, not a one-off sizing exercise.
Q2BasicConcept
What is headroom?
Headroom is spare capacity deliberately kept above the expected peak, so that forecast errors, sudden spikes, autoscaling lag and partial failures do not push the system past its knee, where latency climbs sharply. It is expressed as a margin over forecast, ShopNow uses at least 30%, plus a separate allowance for losing an availability zone. Headroom exists in layers: running pods, warm spare node capacity from placeholder pods, and reserved limits in databases and downstream services. Too little and the first surprise becomes an incident; too much and you pay for idle resources. Tier-0 paths such as checkout justify more headroom than internal reporting.
Q3IntermediateConcept
What load test types exist?
Each test type answers a different question. A load test checks whether the system meets its SLOs at the expected peak with a realistic request mix. A stress or breakpoint test keeps increasing load until SLOs break, revealing where the knee is and how the system fails. A spike test applies sudden jumps, such as five times normal in 30 seconds, to see how autoscaling and shedding cope. A soak test runs normal load for 8 to 24 hours to expose leaks, connection exhaustion and slow degradation. A failover test removes an AZ, node group or cache under load to check that the remaining capacity holds.
Q4IntermediateEstimation
What is Little's law used for?
Little's law says that the average number of requests in a system equals throughput multiplied by the average time each request spends there. It lets you size thread pools, connection pools and semaphores from measured numbers rather than guesses. For example, ShopNow checkout at 2,100 requests per second with 0.15 second latency has about 315 requests in flight across the fleet. Per pod, a target of 300 requests per second at 0.2 seconds means about 60 concurrent requests, which is fine for Tomcat or virtual threads. The same maths shows the risk: if latency doubles during an incident, concurrency doubles too and pools exhaust.
Q5Senior EngineerTricky
Why isn't autoscaling enough?
Autoscaling reacts to load after it arrives, and it has limits it cannot see. HPA takes 30 to 90 seconds to act and new nodes another one to two minutes, so a tenfold flash-sale spike in 30 seconds overwhelms the fleet before help arrives; ShopNow saw a p99 of 2 seconds for three minutes. Scaling pods does not scale shared dependencies: more pods can exhaust Aurora connections or a partner rate limit faster. Account quotas for vCPU, ENIs or IP addresses can stop scaling entirely. So combine autoscaling with pre-scaling for known events, warm placeholder capacity, downstream agreements, raised quotas and load shedding.
Q6Senior EngineerScenario
How do you find shared bottlenecks?
Run scale tests beyond single-pod capacity and look for where throughput stops growing linearly. First measure one pod's maximum rps at the SLO, for example 120. Then test at increasing pod counts: if 10 pods give 1,200 rps but 40 give only 3,000, something shared is saturating. Instrument the shared components during the test: database connections, CPU and lock waits, cache operations per shard, Kafka partitions and consumer lag, NAT gateway throughput and partner response times. At ShopNow, a test at 2.5 times peak showed 80 pods opening 1,600 connections and exhausting Aurora, which led to RDS Proxy and smaller pools before the sale.
Q7Technical ArchitectEstimation
How do you plan for AZ loss?
Provision so that the remaining zones can carry full peak load without help from autoscaling. With three AZs, losing one leaves two thirds of capacity, so each AZ must handle half of peak, which means provisioning about 150% of peak across all three. With autoscaling you can provision less and rely on scale-out, but only if AZ failure does not also block scaling through capacity shortages or quotas, so tier-0 services normally keep static stability. Spread pods with topology spread constraints, keep databases Multi-AZ with replicas able to take writes, and test the assumption by removing an AZ during a load test rather than trusting the arithmetic.
Q8Technical ArchitectDesign
What is load shedding?
Load shedding is deliberately rejecting some work when a service is near saturation so that the most important work keeps meeting its SLOs, instead of everything slowing down together. You classify requests by priority, for example checkout payment over recommendations, and when a saturation signal crosses a threshold, such as available permits, CPU or queue depth, low-priority requests get a fast 503 with Retry-After. Degradation goes with it: disable non-essential features and queue non-critical work such as emails. ShopNow disables recommendations above 85% CPU. Shedding must be fast and cheap, happen early in the request, and be paired with client retry budgets so rejected work does not return as a retry storm.
Q9Solution ArchitectTrade-off
How do you balance cost and capacity?
Pay for guaranteed capacity only where it is needed, and make the rest elastic. Provisioning permanently for peak would cost ShopNow about ₹48 lakh a month, against ₹21 lakh with autoscaling plus pre-scaling for known events. Headroom is set by tier: checkout and payments get generous headroom and AZ-loss tolerance, while reporting runs with little and is throttled or shed first. Buy the steady baseline with Savings Plans, run elastic stateless work on Spot, and reserve capacity for critical event days. Use ephemeral, production-sized test environments instead of permanent ones. Compare plan versus actual after each event, since Diwali's extra cost came in at ₹2.7 lakh against ₹3.1 lakh planned.
Q10Solution ArchitectBehavioural
What should a capacity review include?
A capacity review brings product, marketing, engineering, SRE and finance together, quarterly and before every major event, because no single team holds all the inputs. Cover the demand forecast and the business events behind it, load-test results including per-pod capacity, breakpoints and failure modes, and current utilisation against capacity per service. Review shared limits: database connections, cache shards, partitions, partner agreements and AWS quotas. List risks and mitigations such as pre-scaling, shedding and degradation, and cost against budget. Finish with owners and dates for every action, then review the last event's plan against actuals so the next forecast improves. Clear owners matter more than slides.
Newsletter
Get new tutorials every week
New ArchitectMind tutorials and interview questions, once a week. No spam, unsubscribe anytime.
Your subscription could not be saved. Please try again.
Almost done! Check your inbox and click the confirmation link to complete your subscription.
Keep going in Book 9
Cloud, Containers, DevOps & Production Architecture
 Architect