 Architect

- Chapter
- Chapter 1 — DevOps Fundamentals
- Prerequisites
- Volumes I–IV (context)
- You will be able to
- Explain DevOps as a socio-technical approach, apply CALMS and the three ways, measure delivery with DORA metrics, map value streams, identify capabilities and architecture choices that improve performance, avoid common anti-patterns, and relate DevOps to SRE and platform engineering
- Covers
- DevOps
On this page
- 1. Concept / Definition
- 2. Why It Exists
- 3. Core Concepts — DevOps
- 4. How It Works Internally — Capabilities Behind Performance
- 4A. Deep Dive — ShopNow DevOps Transformation
- 4B. Deep Dive — Value Stream Map (idea → production, before)
- 4C. Deep Dive — Architecture's Role in DevOps
- 4D. Deep Dive — DevOps Maturity Assessment (ShopNow, year 0 → year 2)
- 5. APIs / Features / Syntax
- 6. Practical Examples
- 7. Common Problems & Mistakes
- 8. Performance & Production Considerations
- 9. Architecture & Design Considerations
- 10. Interview Questions & Answers
1Concept / Definition
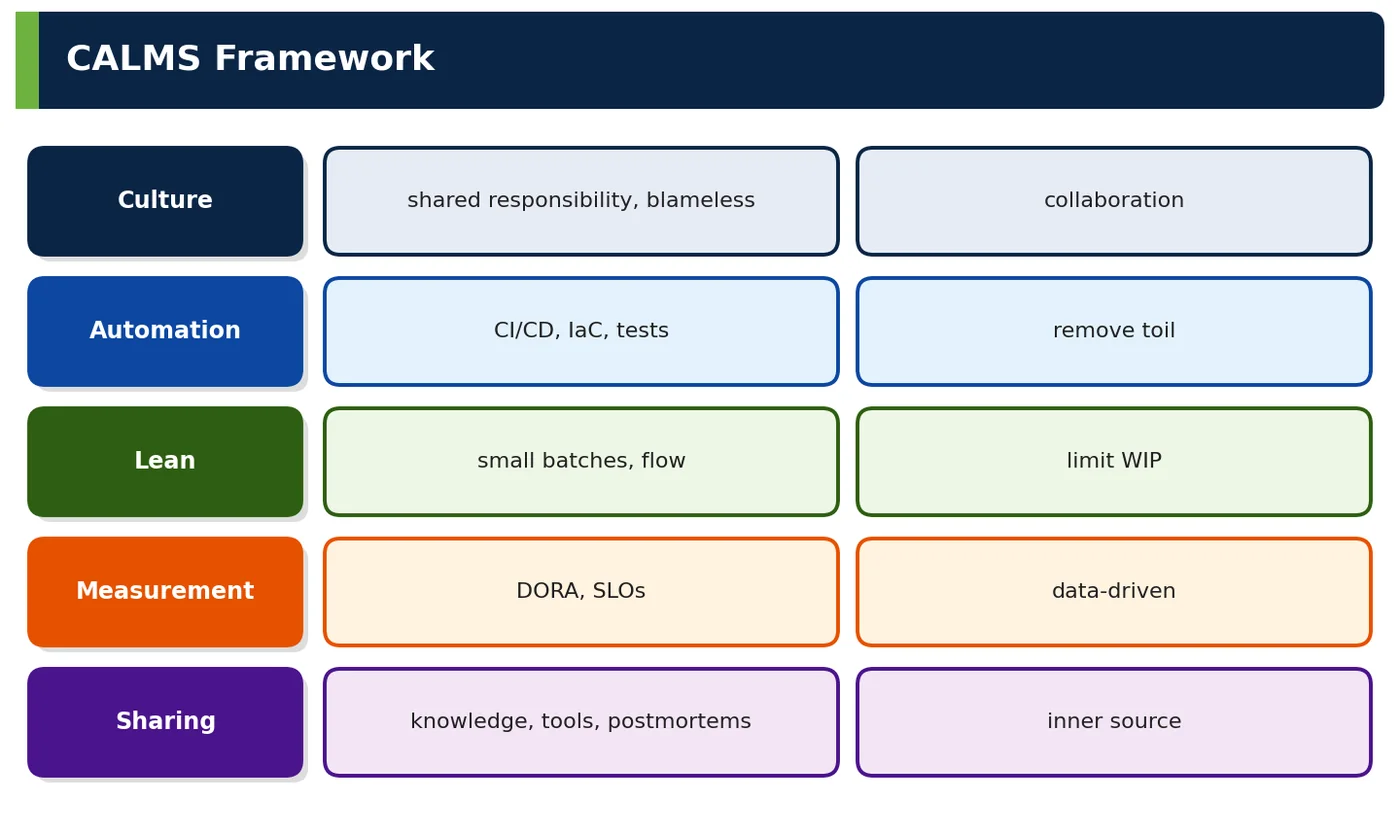
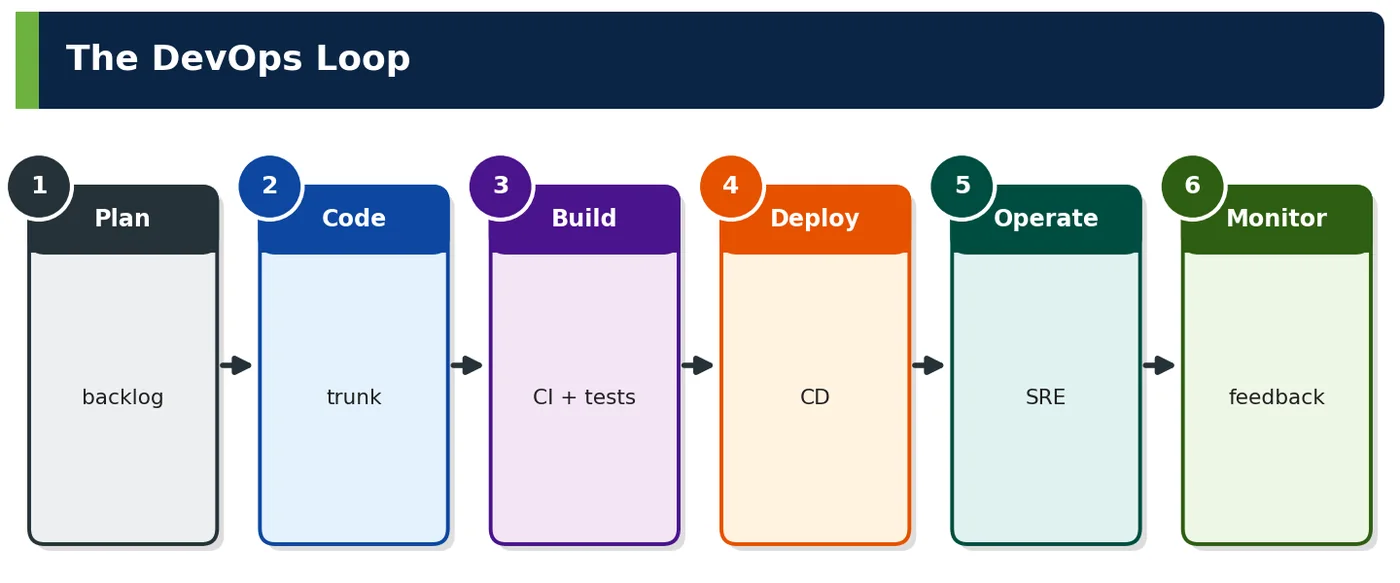
DevOps is a set of cultural principles, practices and tools that unify software development and operations so organisations deliver changes quickly, reliably and safely. It emphasises shared ownership of outcomes, automation of repetitive work, small batches, fast feedback from production and continuous learning.
| Vocabulary | Meaning |
|---|---|
| Lead time for changes | Commit to running in production |
| Change failure rate | % of deployments causing failure |
| Value stream | Steps from idea to customer value |
| Blameless postmortem | Learning review without blame |
2Why It Exists
| Traditional problem | DevOps answer |
|---|---|
| Quarterly big-bang releases | Small, frequent changes |
| Dev vs ops conflict (speed vs stability) | Shared goals and metrics |
| Manual, error-prone deployments | Automation |
| Blame after incidents | Learning culture |
3Core Concepts — DevOps
| The three ways | Practice |
|---|---|
| Flow (left to right) | Small batches, CI/CD, limit WIP |
| Feedback (right to left) | Monitoring, fast tests, postmortems |
| Continual learning | Experimentation, blameless culture, sharing |
4How It Works Internally — Capabilities Behind Performance
| Capability | Architecture/engineering link |
|---|---|
| Trunk-based development | Small PRs, feature flags |
| Continuous integration | Fast, reliable pipelines |
| Continuous delivery | Deployment automation, environments |
| Loosely coupled architecture | Independent deployability (microservices, contracts) |
| Observability | SLOs, tracing |
| Generative culture | Psychological safety, shared learning |
4ADeep Dive — ShopNow DevOps Transformation
| Metric | Year 0 | Year 2 |
|---|---|---|
| Deployment frequency | 4/day (whole org) | 46/day |
| Lead time for changes | 9 days | 1.5 days |
| Change failure rate | 14% | 3% |
| Time to restore | 3.5 h | 35 min |
| Team model | Dev + separate ops | Service teams on-call + platform + SRE |
4BDeep Dive — Value Stream Map (idea → production, before)
| Step | Process time | Wait time |
|---|---|---|
| Refine story | 2 h | 3 days |
| Code + review | 1 day | 2 days |
| Integration test (shared env) | 4 h | 3 days |
| Change board approval | 30 min | 4 days |
| Manual deploy (ops) | 2 h | 2 days |
| Total | ~2 days work | ~14 days waiting |
4CDeep Dive — Architecture's Role in DevOps
| Architecture choice | DevOps effect |
|---|---|
| Independently deployable services | Teams release without coordination |
| Backward-compatible contracts | Deploy in any order |
| Immutable artefacts and infrastructure | Reliable, repeatable deployments |
| Observability built in | Fast feedback and recovery |
| Platform with golden paths | Low cognitive load |
4DDeep Dive — DevOps Maturity Assessment (ShopNow, year 0 → year 2)
| Capability | Year 0 | Year 2 |
|---|---|---|
| Version control for everything | Partial | Code, IaC, config, policies |
| Trunk-based development | No (long branches) | Yes |
| Deployment automation | Scripts by ops | GitOps + canary |
| Test automation | Unit only | Unit, contract, e2e, perf smoke |
| Observability | Logs only | Metrics, traces, SLOs |
| Loosely coupled architecture | Monolith + shared DB | Services + contracts |
| Postmortems | Blame-oriented | Blameless, tracked |
5APIs / Features / Syntax
-- DORA metrics from deployment and incident events (Athena over pipeline + incident data)
WITH deploys AS (
  SELECT service, deployed_at, commit_time, failed
  FROM delivery.deployments
  WHERE env = 'prod' AND deployed_at >= date_add('day', -30, now())
)
SELECT service,
       count(*) / 30.0                                        AS deploys_per_day,
       approx_percentile(date_diff('hour', commit_time, deployed_at), 0.5)
                                                              AS lead_time_h_p50,
       avg(CASE WHEN failed THEN 1.0 ELSE 0 END)              AS change_failure_rate
FROM deploys GROUP BY service;# Deployment event emitted by the pipeline (used for DORA and change correlation)
event: deployment
service: checkout
version: 2.4.1+7f3c2a1
env: prod
commit_time: 2026-09-28T08:12:44Z
deployed_at: 2026-09-28T09:05:10Z
change_id: CHG-88213
strategy: canary
result: success# Blameless postmortem template (excerpt)
## Summary
## Impact (users, duration, SLO budget consumed)
## Timeline (detection → mitigation → resolution)
## Contributing factors (technical, process — no individual blame)
## What went well / what was hard
## Action items (owner, due date, tracking link)6Practical Examples
6.1 Removing the change board wait
A weekly change advisory board added 4 days of waiting. Replacing it with automated evidence (tests, canary analysis, approvals in PRs) for standard changes cut lead time by a third.
6.2 Blameless review improved reliability
After a DNS misconfiguration outage, a blameless review found missing validation in the pipeline rather than "human error"; a policy check prevented recurrence.
6.3 DevOps team anti-pattern reversed
A "DevOps team" that did all deployments became a bottleneck. Its engineers moved into the platform team building self-service, and service teams took ownership of deployments.
6.4 Worked example — DORA calculation
Scenario. ShopNow's leadership wanted to know whether DevOps practices were improving delivery, but each team reported progress differently.
| Service | Deploys/30 days | Failed | CFR |
|---|---|---|---|
| checkout | 120 | 3 | 2.5% |
| orders | 64 | 2 | 3.1% |
What it shows. The table calculates change failure rate per service from 30 days of data. Checkout deployed 120 times with 3 failed deployments, a rate of 2.5%; orders deployed 64 times with 2 failures, 3.1%. Calculating DORA metrics per service, from pipeline and incident data, shows where delivery is healthy and where it needs help. Trends over months then show whether practices are working. The data is collected automatically from the deployment pipeline and the incident tool, so nobody has to fill in spreadsheets and the numbers cannot be adjusted by hand.
Common mistake. Reporting one organisation-wide average. It hides struggling services behind high-performing ones.
Takeaway. Measure DORA metrics per service from real data, and use trends to guide improvement rather than to rank teams.
6.5 Worked example — reliability as fifth metric
Scenario. A ShopNow team doubled its deployment frequency in a quarter, but customers noticed more errors.
| Metric | Source |
|---|---|
| SLO attainment | Error budgets |
What it shows. DORA research now adds reliability as a fifth metric, measured here through SLO attainment from error budgets. Looking at speed metrics alone rewarded the team for deploying more often even as reliability fell. With SLO attainment on the same dashboard, the trade-off became visible, and the team slowed releases until its error budget recovered. Within a month the team's SLO attainment recovered, and it resumed frequent deployments with better test coverage around the areas that had caused errors.
Common mistake. Celebrating speed metrics without checking reliability. Faster delivery of broken software is not progress.
Takeaway. Track reliability alongside speed, so improvements in one do not hide damage to the other.
6.6 Worked example — WIP limits
Scenario. A ShopNow team had twelve stories in progress at once and finished very few each sprint.
| Team | WIP limit |
|---|---|
| In progress stories | ≤ team size |
What it shows. Work-in-progress limits restrict how many items can be in progress at the same time, here no more than the number of people in the team. With fewer items in flight, people swarm on finishing work, lead time falls and context switching drops. The team's lead time halved within two sprints. The limit is visible on the team board, and when it is reached, the next person helps finish an existing item instead of starting a new one.
Common mistake. Starting new work whenever someone is blocked. Unfinished work piles up and nothing reaches customers.
Takeaway. Limit work in progress to finish faster. Stop starting, start finishing.
6.7 Worked example — interview whiteboard
Scenario. In interviews, ShopNow asks, "What is DevOps and how would you drive it?"
| Prompt | Answer outline |
|---|---|
| "What is DevOps and how would you drive it?" | "A socio-technical approach unifying dev and ops around shared outcomes: CALMS (culture, automation, lean, measurement, sharing) and the three ways (flow, feedback, learning). Measure with DORA metrics plus reliability; map the value stream to remove waits; enable with trunk-based development, CI/CD, loosely coupled architecture, observability, platforms with golden paths, blameless postmortems; avoid tool-only or 'DevOps team' silos." |
Why it works. The outline describes DevOps as a socio-technical approach that unites development and operations around fast, reliable delivery. It covers culture, automation, lean flow, measurement and sharing, and explains how to drive it: measure DORA metrics, map the value stream, remove the biggest delays, and support teams with platform tooling. Adding a short example, such as reducing lead time by automating a manual approval, makes the answer concrete and believable.
Common mistake. Describing DevOps as a set of tools or a job title. Interviewers look for culture, flow and measurement.
Takeaway. Explain DevOps as a way of working and show how you would measure and drive it.
6.8 Worked example — PayGrid regulated DevOps
Scenario. PayGrid operates under financial regulation that requires segregation of duties and change evidence, which some feared would make DevOps impossible.
| Constraint | DevOps adaptation |
|---|---|
| Segregation of duties | Automated approvals by non-authors in PRs |
| Change evidence | Pipeline-generated |
What it shows. The table shows how DevOps practices adapt. Segregation of duties is achieved by automated checks and approval by someone other than the author in pull requests, rather than a separate operations team. Change evidence is produced by the pipeline itself, including tests, approvals and deployment records. PayGrid deploys several times a day and still passes audits. Auditors found the automated evidence more complete than the old manual change forms, because every step was recorded consistently by the pipeline.
Common mistake. Assuming regulation requires slow, manual release processes. Most requirements can be met better through automation.
Takeaway. Adapt DevOps practices to regulatory requirements instead of treating regulation as a barrier.
6.9 Worked example — anti-patterns
Scenario. ShopNow's first DevOps attempt bought expensive tools and created a DevOps team, but delivery speed did not change.
| Anti-pattern | Effect |
|---|---|
| Buying tools without changing process | No outcome change |
| DevOps team silo | New bottleneck |
| Metrics as targets for individuals | Gaming |
| Speed without SLOs | Reliability decline |
What it shows. The table lists anti-patterns. Buying tools without changing process brings no improvement. A separate DevOps team becomes a new silo between development and operations. Using metrics as targets leads teams to game them. Each anti-pattern addresses symptoms rather than how work actually flows. ShopNow's second attempt focused on one value stream, removed its biggest delays and measured lead time, which finally produced visible improvement.
Common mistake. Measuring adoption by tools purchased or teams renamed, rather than by delivery outcomes.
Takeaway. Focus DevOps on changing how teams work and measure outcomes, not on tools or titles.
6.10 Worked example — generative culture signals
Scenario. After a serious incident, ShopNow's leadership wanted to know whether the culture encouraged learning or blame.
| Signal | Example |
|---|---|
| Information flows freely | Incident reviews shared org-wide |
| Failure leads to inquiry | Blameless |
What it shows. Signs of a generative culture are concrete. Information flows freely, for example incident reviews are shared across the organisation. Failure leads to inquiry rather than punishment, through blameless post-incident reviews. ShopNow uses these signals, along with survey results, to assess culture over time. Survey scores for psychological safety rose over the following year, and teams began reporting near misses before they became incidents.
Common mistake. Declaring a blameless culture while still searching for someone to blame after incidents.
Takeaway. Look for observable behaviours that show a learning culture, and reinforce them consistently.
6.11 Worked example — feedback loops
Scenario. ShopNow developers waited 40 minutes for CI results, so they batched changes and found problems late.
| Loop | Speed target |
|---|---|
| CI result | < 10 min |
| Canary analysis | < 30 min |
| Customer usage metrics | Same day |
What it shows. Fast feedback loops speed up learning. Targets are CI results within 10 minutes, canary analysis within 30 minutes and customer usage metrics the same day. Parallel tests and better caching brought CI under 10 minutes, and developers returned to small, frequent commits. Faster feedback also reduced the number of broken main-branch builds, because problems were caught minutes after they were introduced.
Common mistake. Accepting slow pipelines as normal. Slow feedback quietly pushes teams towards large, risky batches.
Takeaway. Set explicit targets for feedback speed and invest in meeting them.
6.12 Worked example — on-call ownership
Scenario. At ShopNow, a central operations team handled all incidents, while developers rarely saw how their services behaved in production.
| Model | Detail |
|---|---|
| Service teams on-call for own services | Incentive for quality |
| Platform/SRE on-call for platform | Clear boundaries |
What it shows. ShopNow moved to service teams being on call for their own services, which creates a strong incentive to build reliable, operable software. Platform and SRE teams are on call for shared platforms, with clear boundaries. Incident counts fell as teams fixed the problems that woke them up. Teams now review their noisiest alerts each sprint and fix the underlying causes, which has steadily reduced night-time pages.
Common mistake. Putting teams on call without training, tooling or reasonable alert quality, which leads to burnout.
Takeaway. Align on-call responsibility with ownership, and support it with good tooling and alerts.
6.13 Worked example — DevOps and SRE
Scenario. ShopNow's leadership asked how DevOps and its new SRE team fit together.
| Aspect | SRE contribution |
|---|---|
| SLOs and error budgets | Balance speed and reliability |
| Toil reduction | Automation |
What it shows. SRE contributes specific practices to DevOps goals. SLOs and error budgets balance delivery speed with reliability. Toil reduction through automation frees time for improvement. SRE is one concrete way to implement DevOps principles for reliability. Error-budget policies gave product owners and engineers a shared, objective way to decide when to slow down releases.
Common mistake. Treating SRE as a renamed operations team that takes over production from developers.
Takeaway. Use SRE practices to make reliability measurable and to automate operational work within a DevOps culture.
6.14 Worked example — DevOps and platform engineering
Scenario. Teams at ShopNow struggled with the cognitive load of "you build it, you run it", handling pipelines, infrastructure and monitoring themselves.
| Aspect | Platform contribution |
|---|---|
| Self-service, golden paths | Reduce cognitive load of "you build it, you run it" |
What it shows. Platform engineering reduces that load with self-service tools and golden paths: standard templates, pipelines and infrastructure modules that work out of the box. Teams keep ownership, but do not need to reinvent the platform. New services now go from template to production in a day. Platform usage is tracked, and features that teams do not adopt are reviewed or removed, so the platform stays focused on real needs.
Common mistake. Building a platform nobody asked for. Platforms must solve real problems for the teams using them.
Takeaway. Support DevOps with an internal platform that makes the right way the easy way.
6.15 Worked example — measuring culture
Scenario. ShopNow wanted to know whether its culture was improving, beyond anecdotes.
| Instrument | Use |
|---|---|
| Annual DevEx/culture survey | Trends |
What it shows. An annual developer-experience and culture survey measures trends over time, such as psychological safety, collaboration and tooling satisfaction. Combined with DORA metrics, it shows whether culture changes are accompanied by better delivery. ShopNow publishes results and actions to all teams. One action from the first survey, faster CI, became the platform team's top priority and visibly improved the next year's results.
Common mistake. Running surveys without sharing results or acting on them. Participation and trust then decline.
Takeaway. Measure culture regularly, share the results and act on them.
6.16 Worked example — transformation roadmap
Scenario. ShopNow's leadership wanted a realistic plan for DevOps transformation rather than trying to change everything at once.
| Phase | Focus |
|---|---|
| 1 | CI and trunk-based development |
| 2 | Deployment automation, environments |
| 3 | Observability, SLOs, on-call |
| 4 | Platform self-service, continuous deployment |
What it shows. The roadmap sequences the work. Phase 1 focuses on CI and trunk-based development. Phase 2 automates deployments and environments. Phase 3 adds observability, SLOs and team on-call. Each phase builds on the previous one and delivers measurable improvement. Each phase had clear success metrics, so leadership could see progress and decide when to move on to the next phase.
Common mistake. Starting with advanced practices, such as chaos engineering, before basic automation is in place.
Takeaway. Sequence DevOps transformation so each phase builds a foundation for the next.
6.17 Worked example — interview follow-ups
Scenario. In interviews, ShopNow uses follow-up questions to test real DevOps understanding.
| Follow-up | Answer |
|---|---|
| "Is DevOps a role?" | It's a way of working; platform/SRE roles support it |
| "Which metric first?" | Lead time — reveals waits |
Why it works. Typical follow-ups have concise answers. Is DevOps a role? No, it is a way of working; platform and SRE roles support it. Which metric would you improve first? Usually lead time, because it reveals waiting and waste across the whole process. Interviewers then ask about a time the candidate improved lead time, so having a real example ready is essential.
Common mistake. Giving rehearsed definitions without practical examples from experience.
Takeaway. Prepare short, practical answers to common DevOps follow-ups.
6.18 Worked example — checklist
Scenario. ShopNow assesses each team's DevOps maturity with a checklist.
| Item | ✔ |
|---|---|
| DORA measured | ✔ |
| Value stream mapped | ✔ |
| Teams own services | ✔ |
| Blameless reviews | ✔ |
| Automation of toil | ✔ |
| Architecture supports independent deploys | ✔ |
What it shows. The checklist confirms that DORA metrics are measured, the value stream is mapped, teams own their services, incident reviews are blameless and toil is being automated. Gaps become improvement goals for the next quarter. The checklist is reviewed in quarterly team retrospectives, so improvements are planned rather than left to chance.
Common mistake. Treating the checklist as a compliance exercise rather than a guide for improvement.
Takeaway. Use a DevOps checklist to guide regular improvement conversations.
6.19 Worked example — batch size economics
Scenario. ShopNow's release process bundled a month of changes into one large deployment that often failed.
| Batch | Risk | Feedback |
|---|---|---|
| Small | Low | Fast |
| Large | High | Slow |
What it shows. Lean principles favour small batches. Small changes carry low risk and give fast feedback; large batches carry high risk and slow feedback. After moving to daily small releases, ShopNow's change failure rate dropped sharply and problems were easier to diagnose. Smaller releases also made rollbacks rare and routine, instead of stressful events requiring many people.
Common mistake. Believing that releasing less often is safer. Larger batches usually increase risk.
Takeaway. Reduce batch size to lower risk and speed up feedback.
6.20 Worked example — sharing practices
Scenario. Good practices in one ShopNow team often remained unknown to others.
| Practice | Example |
|---|---|
| Internal tech talks | Monthly |
| Inner-source repos | Shared libraries |
What it shows. Sharing practices spreads knowledge. Monthly internal tech talks present lessons and tools, and inner-source repositories let teams contribute to shared libraries. One team's improved test setup was adopted by six others within a quarter. Contributions to shared libraries are now recognised in performance reviews, which encourages more teams to share.
Common mistake. Relying on informal conversations to spread practices. Knowledge stays in small groups.
Takeaway. Create regular, structured ways for teams to share practices and code.
6.21 Worked example — leadership role
Scenario. ShopNow's engineers wanted to adopt DevOps practices, but lacked time and support.
| Action | Effect |
|---|---|
| Fund platform and automation | Removes toil |
| Reward learning from failure | Safety |
What it shows. Leadership actions make the difference. Funding platform and automation work removes toil, and rewarding learning from failure builds psychological safety. When leaders visibly supported blameless reviews, teams began reporting problems earlier. Leaders also attend incident reviews and ask what the system allowed to go wrong, not who made the mistake.
Common mistake. Expecting DevOps to happen bottom-up without leadership investment or protection.
Takeaway. Leaders must fund DevOps work and model the behaviours they want.
6.22 Worked example — ROI framing
Scenario. ShopNow's CFO asked what the DevOps investment had delivered in business terms.
| Improvement | Value |
|---|---|
| Lead time 9 → 1.5 days | Features reach customers weeks earlier |
| CFR 14% → 3% | Fewer incidents and rework |
What it shows. Improvements were framed as value. Lead time falling from nine days to 1.5 days means features reach customers weeks earlier. Change failure rate falling from 14% to 3% means fewer incidents and less rework. These outcomes were tied to revenue and cost estimates. The CFO approved further platform investment after seeing the estimated revenue impact of faster feature delivery.
Common mistake. Reporting only technical metrics to business leaders, who cannot connect them to value.
Takeaway. Translate DevOps improvements into business outcomes such as speed to market and avoided incidents.
6.23 Worked example — interview scenario
Scenario. In an interview, ShopNow asks: "Leadership wants DevOps in three months. What do you do?"
| Question | Answer |
|---|---|
| "Leadership wants DevOps in 3 months" | Set outcome metrics, pick one value stream, remove top waits, expand iteratively |
Why it works. A strong answer sets outcome metrics, picks one value stream, removes the biggest delays in it and expands what works to other teams. It is honest that full transformation takes longer, but shows how to deliver visible progress quickly. Interviewers value candidates who manage expectations honestly while still showing how to deliver early wins.
Common mistake. Promising a complete transformation in three months, which sets up failure.
Takeaway. Answer with a focused, measurable plan and realistic expectations.
6.24 Worked example — DevOps and security
Scenario. ShopNow's security reviews happened only before major releases, which slowed delivery and found problems late.
| Practice | Detail |
|---|---|
| Security checks in pipelines (DevSecOps) | Chapter 6 |
What it shows. DevSecOps brings security checks into pipelines: dependency scanning, static analysis, secret detection and infrastructure policy checks run on every change. Problems are found within minutes of being introduced, and releases are no longer blocked by late reviews. Security findings per release dropped, and developers fixed most issues before code review even began.
Common mistake. Adding so many security checks that pipelines become slow and noisy, so developers ignore them.
Takeaway. Shift security left with fast, relevant automated checks in pipelines.
6.25 Worked example — dashboards for DORA
Scenario. ShopNow wanted DORA results to drive improvement rather than comparison between teams.
| Panel | Audience |
|---|---|
| Per-team DORA trends | Teams (improvement) |
| Org-level summary | Leadership |
What it shows. Dashboards serve different audiences. Per-team DORA trends help teams see their own improvement. An organisation-level summary gives leadership an overview without ranking teams. Visibility encourages progress without encouraging gaming. Teams use their own dashboards in retrospectives, while leadership reviews the summary quarterly to decide where to invest.
Common mistake. Publishing team rankings, which leads teams to optimise metrics rather than outcomes.
Takeaway. Make DORA progress visible in ways that support improvement, not competition.
7Common Problems & Mistakes
| Mistake | Fix |
|---|---|
| Tool-only change | Process + culture |
| Silo DevOps team | Platform + ownership |
| No measurement | DORA |
| Blame culture | Blameless reviews |
8Performance & Production Considerations
| Consideration | Practice |
|---|---|
| Pipeline speed | Fast feedback |
| Reliability guardrails | SLOs, error budgets |
| On-call sustainability | Alert hygiene |
9Architecture & Design Considerations
| Guideline | Detail |
|---|---|
| Design for independent deployability | Loose coupling |
| Build in observability | Feedback |
| Platform to reduce load | Scale |
10Interview Questions & Answers
What is DevOps?
DevOps is a set of cultural values, practices and tools that unite software development and operations around delivering value quickly and reliably. Instead of developers handing code to a separate operations team, cross-functional teams build, deploy and run their services, supported by automation for building, testing, deploying and monitoring. DevOps emphasises small batches, fast feedback, shared responsibility and continuous learning. It is measured by outcomes such as deployment frequency, lead time, change failure rate and time to restore, rather than by the tools a team uses.
What are the DORA metrics?
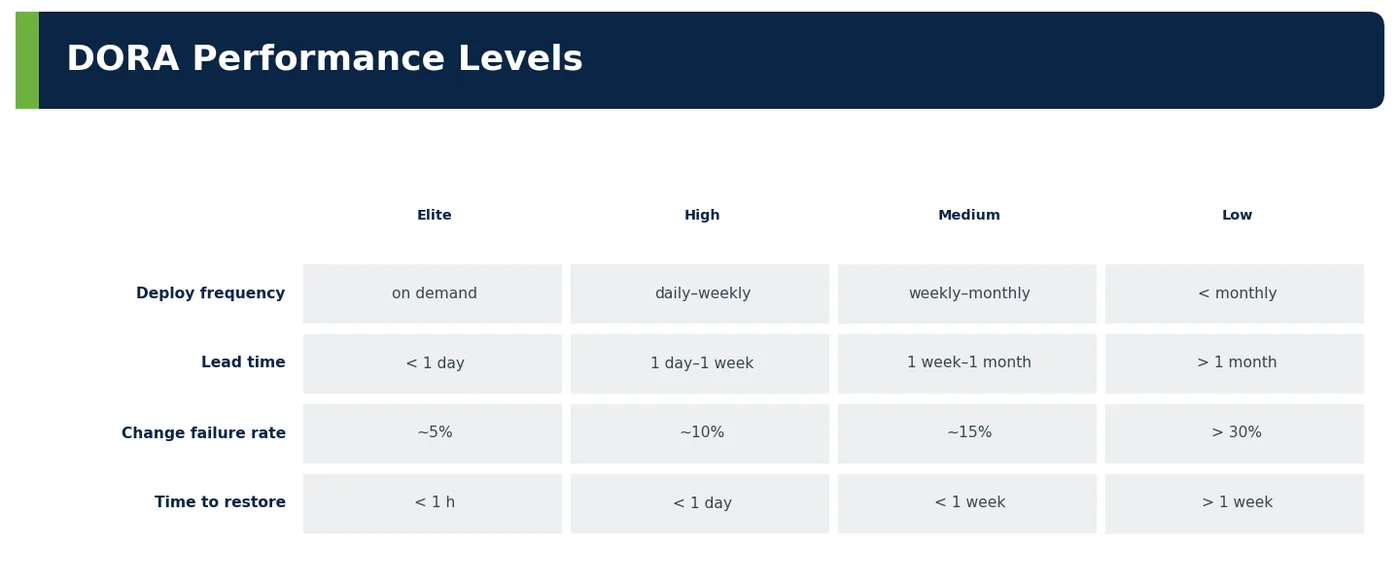
The DORA metrics come from the DevOps Research and Assessment programme. Deployment frequency measures how often a team deploys to production. Lead time for changes measures how long a commit takes to reach production. Change failure rate measures the percentage of deployments that cause a failure needing remediation. Time to restore service measures how quickly service is recovered after a failure. The first two measure speed and the last two stability; research shows high performers do well on both. Reliability has since been added as a fifth measure. Measure them per service and look at trends rather than single values.
What does CALMS stand for?
CALMS is a framework describing the main elements of DevOps. Culture means shared responsibility, trust and learning from failure. Automation means automating builds, tests, deployments and infrastructure to make delivery fast and repeatable. Lean means focusing on flow, small batches and removing waste. Measurement means using data, such as DORA metrics, to guide improvement. Sharing means spreading knowledge, tools and practices across teams. Assessing an organisation against each element shows where to focus effort. Teams can score themselves on each element to choose where to start.
What are the three ways?
The three ways, described in The Phoenix Project and The DevOps Handbook, are the principles behind DevOps. The first way is flow: optimising the fast, smooth movement of work from development to production, with small batches and fewer handoffs. The second way is feedback: creating fast feedback loops from production back to development, so problems are found and fixed quickly. The third way is continual learning and experimentation: building a culture where teams learn from failures and improve continuously. Together they describe a continuous improvement loop rather than a one-time project.
Why are small batches important?
Small batches reduce risk because each change contains less that can go wrong, and when something does go wrong, it is easier to find and fix. They give faster feedback, because changes reach production and users sooner. They make rollback simpler, because only a small change is reversed. They also reduce merge conflicts and the effort of reviewing. Large batches, by contrast, combine many changes, so failures are more likely and harder to diagnose. That is why high-performing teams deploy small changes frequently. Feature flags help by separating deployment from release.
What's wrong with a "DevOps team"?
Creating a separate "DevOps team" often recreates the very silo DevOps is meant to remove. Development teams hand work to the DevOps team for pipelines and infrastructure, which becomes a new bottleneck and a new handoff. Ownership of production stays separated from the people who write the code. DevOps works better when cross-functional teams own their services end to end, supported by a platform team that provides self-service tools, rather than a team that does the work for them. A platform team that enables others avoids this trap.
How does architecture affect DevOps?
Architecture strongly affects how independently teams can deliver. Loosely coupled services with clear boundaries and backward-compatible contracts can be tested and deployed independently, so teams release without coordinating with others. Tightly coupled systems, such as shared databases or distributed monoliths, force coordinated releases and large batches, which slows delivery and increases risk. DORA research found that architecture enabling independent deployment is one of the strongest predictors of high delivery performance. Architects therefore influence delivery speed as much as tooling does.
How do DevOps and SRE relate?
SRE, site reliability engineering, is a concrete way to implement DevOps principles with a focus on reliability. It introduces SLOs and error budgets, which balance the pace of change against reliability targets; reduces toil through automation; and applies engineering to operations problems. DevOps describes the culture and goals of shared ownership and fast, reliable delivery; SRE provides specific practices and roles to achieve the reliability part. The two are complementary rather than competing. Many organisations adopt SRE practices without creating a separate SRE team.
How do you start a DevOps transformation?
Start with measurement and a narrow focus. Measure DORA metrics to establish a baseline. Map the value stream for one product to see where work waits, such as manual approvals, slow test environments or release queues. Remove the biggest delays first, often by automating builds, tests and deployments. Show results, then expand to other teams. Invest in platform tooling and training, and make sure leadership supports cultural changes such as blameless reviews and team ownership. Communicate progress regularly so momentum and support continue.
How do you keep speed from hurting reliability?
Use SLOs and error budgets to govern the pace of change. When a service is within its error budget, teams can release freely; when the budget is spent, they slow down and focus on reliability until it recovers. Combine this with progressive delivery, such as canary releases with automated rollback, and good test automation. Track reliability alongside DORA speed metrics. This way, speed and reliability support each other instead of competing. Teams then see reliability as a shared goal rather than an obstacle to delivery.