Define what operational readiness means for a service, write runbooks that a non-author can follow, design actionable alerts linked to runbooks, lay out dashboards that answer "is it us?" in 30 seconds, manage these assets as code, and verify readiness through game days
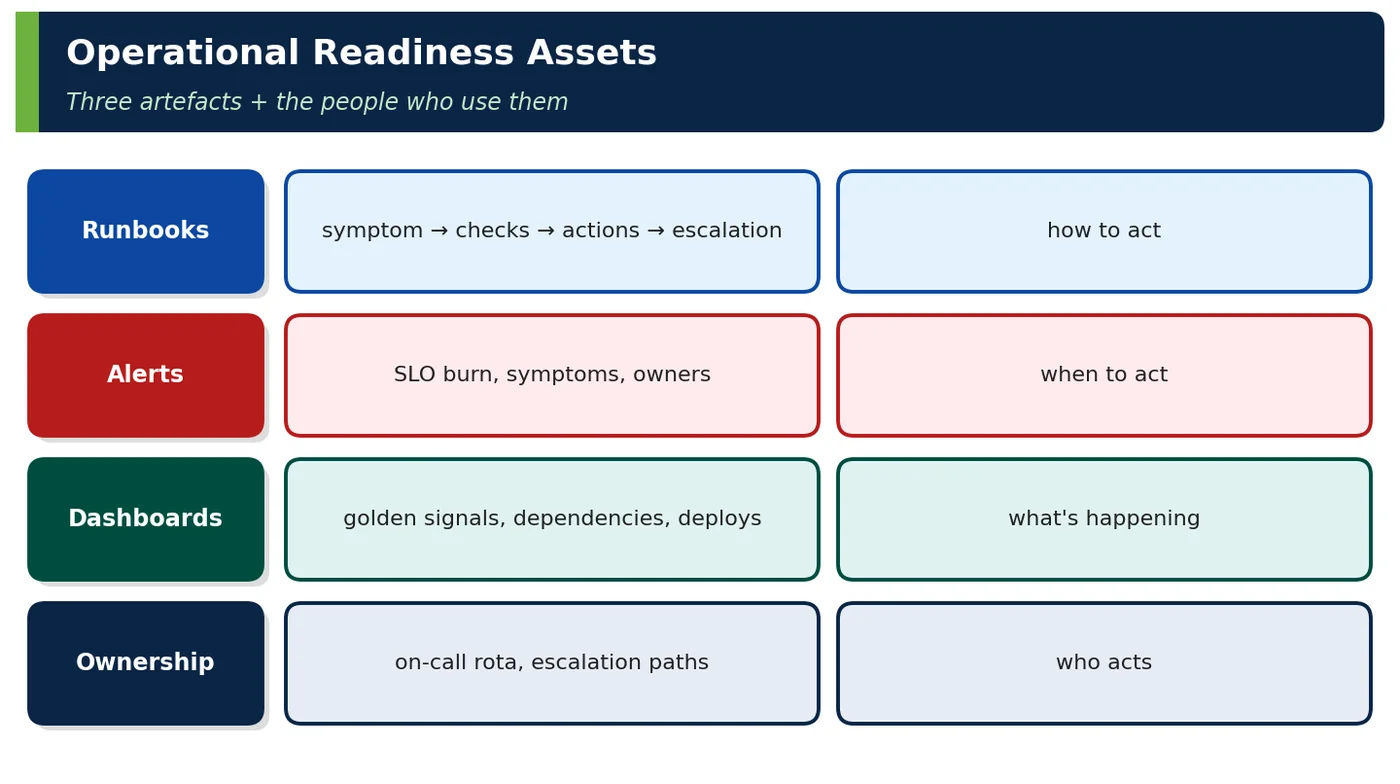
Operational readiness is the state in which a service, its people and its tools are prepared to operate it in production: the team knows when to act (alerts), what's happening (dashboards), how to act (runbooks) and who acts (ownership and on-call). It is proven, not declared.
Figure 1 — Operational readiness assets
Asset
Answers
Quality test
Alerts
When must someone act?
Actionable, symptom-based, owned
Dashboards
What is happening and is it us?
Answer in 30 seconds
Runbooks
What should I do?
Non-author can follow at 3 a.m.
On-call + escalation
Who acts and who helps?
Reachable, trained, sustainable
Table 1 — Readiness assets
Vocabulary
Meaning
Runbook
Step-by-step guide for an operational scenario
Playbook
Broader incident process (roles, comms)
Game day
Planned exercise simulating failures
Annotation
Marker on a graph for deploys, flags, incidents
Table 2 — Terms
2Why It Exists
Unready service symptom
Effect
Alert fires, nobody knows what it means
Delay, guesswork
Dashboards with 60 panels
Can't find the signal
Runbook says "contact Ravi"
Single point of knowledge
No owner in catalog
Pages go to the wrong team
Table 3 — Why readiness matters
3Core Concepts — Operational Readiness
3.1 Runbooks
Figure 2 — Runbook structure
Runbook quality rule
Example
Start from the alert/symptom
"CheckoutErrorBudgetBurnFast"
State impact
"Customers can't place orders; revenue ~₹45k/min"
Link exact dashboards and queries
Grafana URL with variables pre-set
Safe actions first
Rollback latest deploy; disable optional features
Decision points
"If pricing latency > 500 ms → go to section 4"
Escalation
When and whom (with contact routing, not names)
Verification
"Error rate < 0.5% for 10 min"
Table 4 — Runbooks
3.2 Alerts
Figure 3 — Good alert checklist
Alert category
Example
Page?
SLO burn (fast)
Checkout availability burn 14.4× over 1 h
Page
SLO burn (slow)
6× over 6 h
Ticket
Synthetic journey failure
3 consecutive failures
Page
Cause-based (CPU, pod restarts)
For diagnosis
No page — dashboard
Table 5 — Alert tiers (Chapter 4 for detail)
3.3 Dashboards
Figure 4 — Service dashboard layout
Dashboard type
Audience
Service overview (above)
On-call
Journey dashboard (checkout end-to-end)
Incident commander
Business dashboard
Product, leadership
Platform dashboards
Platform team
Table 6 — Different dashboards for different questions
4How It Works Internally — Readiness as Code
Asset
As code
Alerts
PrometheusRule YAML in service repo
Dashboards
Jsonnet/Grafonnet or Terraform Grafana provider
Runbooks
Markdown in repo, rendered in portal; automation via SSM documents
# Runbook: CheckoutErrorBudgetBurnFastImpact: customers cannot place orders (≈ ₹45k/min at peak).1. Open dashboard (link). Check "Deploys & flags" row: deploy in last 30 min? → YES: abort rollout: `kubectl argo rollouts abort checkout -n checkout`. Verify in 5 min.2. Dependency row: which downstream error/latency rose? pricing → go to §4; payments → §5.3. Optional features: disable `checkout.recommendations` and `checkout.reviews` flags.4. Escalate: if not improving in 15 min, page incident commander (PagerDuty "IC-storefront").Verify: 5xx < 0.1% and p99 < 400 ms for 10 min; synthetic checkout green.
6Practical Examples
6.1 Game day found missing runbook step
In a staged pricing-latency game day, the on-call followed the runbook but didn't know how to switch checkout to cached prices. The step (flag name and verification) was added; the next game day resolved in 7 minutes.
6.2 Dashboard redesign
The old checkout dashboard had 64 panels. The new layout (SLOs → golden signals → dependencies → resources, with deploy annotations) cut median time to "is it us?" from 6 minutes to under 1 minute in incident reviews.
6.3 Ownership in the catalog
Before Backstage ownership metadata, 14% of alerts routed to the wrong team. Routing by catalog owner reduced misroutes to under 1%.
6.4 Worked example — runbook coverage by alert
Alert
Runbook
Game-day tested
CheckoutErrorBudgetBurnFast
✔
✔ (Q2)
CheckoutLatencyBurnFast
✔
✔ (Q3)
SyntheticCheckoutFailing
✔
✔
PaymentsPspDegraded
✔
✘ → scheduled
Table 9 — Coverage matrix
6.5 Worked example — dashboard questions per row
Row
Question
SLOs
Are users affected? How much budget left?
Golden signals
Which endpoints? Since when?
Dependencies
Is a downstream the cause?
Resources
Are we saturated?
Annotations
What changed?
Table 10 — Design dashboards around questions
6.6 Worked example — on-call sustainability
Metric
Target
ShopNow
Pages per shift
< 2
1.4
Night pages per week per team
< 1
0.6
Rota size
≥ 6 people
6–8
Follow-the-sun for Tier 0
Yes (IST + EU office)
Yes
Table 11 — Readiness includes humane on-call
6.7 Worked example — interview whiteboard
Prompt
Answer outline
"How do you make a new service operationally ready?"
"Four assets: symptom-based, owned alerts (SLO burn, synthetics) that link to runbooks and dashboards; top-down dashboards — SLOs, golden signals, dependencies, resources, with deploy and flag annotations; runbooks written from the alert's point of view with safe actions first, decision points, escalation and verification; and ownership plus on-call in the service catalog. Manage all as code, and prove readiness with game days run by someone who didn't build it."
Table 12 — Structured answer
6.8 Worked example — automated runbook steps
Step
Automation
Collect diagnostics (thread dump, heap histogram)
Button in portal → SSM/K8s job, attaches to incident
Abort rollout
ChatOps command /rollback checkout
Disable optional features
ChatOps /flag off checkout.recommendations
Table 13 — Runbooks become tools over time
6.9 Worked example — PayGrid readiness
Asset
Special requirement
Runbooks
Include regulatory notification steps and templates
Dashboards
Per cell and per acquirer
Alerts
Per-partner anomaly alerts routed to partner success
Game days
Acquirer failover every month
Table 14 — Domain-specific readiness
6.10 Worked example — templated readiness for new services
Template output
Content
Alerts
SLO burn (fast/slow), synthetic, saturation
Dashboard
Standard four-row layout
Runbook skeleton
Sections pre-filled with links
Catalog entry
Owner, tier, on-call
Table 15 — Paved road makes readiness default
6.11 Worked example — anti-patterns
Anti-pattern
Problem
Runbooks in personal notes
Unavailable to others
Alerts without runbooks
Guesswork
Dashboards built during incidents
Too late
Runbooks never exercised
Wrong when needed
Table 16 — Readiness failures
6.12 Worked example — readiness review agenda (30 min)
Item
Evidence
SLOs and alerts
Rules in repo, test firing
Dashboards
Link, walkthrough
Runbooks
Top 5 failure modes
On-call
Schedule, escalation
Game day
Date and results
Table 17 — Short, evidence-based
6.13 Worked example — post-incident readiness updates
Incident finding
Readiness change
Alert fired 12 min late
Faster burn window
Runbook missing Kafka lag step
Added
Dashboard lacked cell filter
Variable added
Table 18 — Every incident improves readiness
6.14 Worked example — readiness metrics
Metric
Value
Alerts with runbook links
97%
Runbooks exercised in last 6 months
84%
Mean time "is it us?" in incidents
< 1 min
Misrouted pages
< 1%
Table 19 — Readiness measured
7Common Problems & Mistakes
Mistake
Fix
Cause-based pages (CPU)
Symptom/SLO alerts
Dashboards without structure
Question-driven layout
Runbooks that say "investigate"
Concrete checks and safe actions
Readiness not tested
Game days
Assets outside version control
Readiness as code
No owner metadata
Catalog
Table 20 — Mistakes and fixes
8Performance & Production Considerations
Consideration
Practice
Dashboard query cost
Recording rules for heavy queries
Alert evaluation load
Reasonable intervals; recording rules
Game days in production
Guardrails, off-peak, stop conditions
Table 21 — Operating readiness assets
Readiness assets are production systems in their own right and need the same care. Heavy dashboard queries over 30-day windows can overload Prometheus or Grafana exactly during an incident, when everyone opens the same dashboard at once; pre-compute them with recording rules and keep panel counts modest. Alert evaluation has a cost too, so use sensible evaluation intervals and build burn-rate alerts on recording rules rather than on raw high-cardinality series. The observability stack should not share failure modes with what it monitors: run it in a separate account or cluster, and alert on the alerting pipeline itself with a dead-man's-switch heartbeat. Game days in production need guardrails: run them off-peak, limit the blast radius, define stop conditions in AWS Fault Injection Service and have a named person ready to abort.
9Architecture & Design Considerations
Guideline
Detail
Readiness assets part of definition of done
Not post-launch
Templates via platform
Consistency
Ownership metadata central
Routing and discovery
Practice regularly
Game days
Table 22 — Design guidance
10Interview Questions & Answers
Q1BasicConcept
What is operational readiness?
Operational readiness is the state in which a service, its people and its tools are prepared to run it in production, and it must be proven, not declared. It rests on four assets. Alerts tell the team when to act, and must be symptom-based, actionable and owned. Dashboards show what is happening and answer the question 'is it us?' within 30 seconds. Runbooks tell a non-author what to do at 3 a.m. Ownership and on-call define who acts and who helps. The proof is a game day: if an engineer who did not build the service can resolve a simulated failure using these assets, it is ready.
Q2BasicConcept
What makes a good runbook?
A good runbook is written from the alert's point of view, for someone who did not build the service. It starts with the alert or symptom name and states the business impact, such as customers being unable to order at about ₹45,000 a minute. It links the exact dashboards and queries, already filtered. It lists safe actions first, such as aborting the latest rollout or disabling optional features, then decision points, such as going to section 4 if pricing latency exceeds 500 ms. It defines escalation by role or rota rather than by a person's name, and ends with verification criteria, such as error rate below 0.5% for ten minutes.
Q3IntermediateDesign
What should a service dashboard show first?
It should first show whether users are affected: SLO attainment and remaining error budget for the service's key journeys. Next come the golden signals per endpoint, meaning traffic, errors, latency percentiles and saturation, so on-call can see what is failing and since when. Below that, a dependency row shows the error rate and latency of each downstream call, answering whether the cause is us or them, followed by resources such as CPU, memory, pools and pods. Deploy, feature-flag and incident annotations overlay every graph to show what changed. ShopNow's redesign from 64 panels to this layout cut the median time to answer 'is it us?' from six minutes to under one.
Q4IntermediateConcept
What makes an alert good?
A good alert means a human must act now, and it helps them do so. It is symptom-based, firing on what users experience, such as fast SLO burn or a failing synthetic checkout, rather than on causes such as high CPU, which belong on dashboards. It is actionable, with a clear next step, and owned, routed to the team that runs the service through catalog metadata. It links its runbook and dashboard in its annotations. It is tested, having fired in staging or a game day, and rare, because frequent pages create fatigue and get ignored. Slow-burn conditions should open tickets rather than wake people.
Q5Senior EngineerDesign
How do you keep readiness assets current?
Manage them as code in the service repository, so they change in the same pull request as the code that affects them. Alerts are PrometheusRule YAML, dashboards are Jsonnet, Grafonnet or Terraform, runbooks are Markdown rendered in the developer portal, and ownership lives in a Backstage catalog-info.yaml file. Generate the baseline from platform templates so every new service starts complete. Then add feedback loops: every incident review checks whether the alert, dashboard and runbook helped and creates fixes; game days reveal stale steps; and readiness reviews check coverage metrics, such as the share of alerts with runbook links and of runbooks exercised recently.
Q6Senior EngineerConcept
What is a game day?
A game day is a planned exercise in which the team deliberately injects a realistic failure to test whether detection and response actually work. You choose a scenario, such as a pricing latency spike, the loss of a Kafka broker or a bad deploy, and inject it in staging, or in production with guardrails, using AWS Fault Injection Service, a feature flag or a fault proxy. Then you observe whether the right alert fired and reached the right person, and whether the on-call engineer could resolve it using only the runbook and dashboard. Every gap becomes a ticket, and the exercise is repeated until resolution is fast.
Q7Technical ArchitectInternals
How do you route alerts correctly?
Route by ownership metadata, never by hard-coded names or a shared channel. Each service's catalog entry in Backstage records its owning team, tier and PagerDuty service. Alert rules carry team and severity labels, and Alertmanager or the paging tool routes on those labels to the owner's escalation policy, with severity deciding between a page and a ticket. When ownership changes, one catalog edit updates routing everywhere. A CI check that fails when a service has no owner or an alert has no team label keeps the data complete. At ShopNow, routing by catalog owner cut misrouted pages from 14% to under 1%.
Q8Technical ArchitectDesign
How do runbooks evolve?
Runbooks start as documents and gradually become tools. When a step is repeated across incidents and is safe, such as collecting a thread dump and heap histogram, aborting a rollout or disabling an optional feature flag, it gets automated: a portal button that runs an SSM Automation document or Kubernetes job, or a ChatOps command such as /rollback checkout. Automation removes typing errors under pressure, records what was done in the incident timeline and cuts time to mitigation. Judgement steps stay human, but the runbook calls the tools. Every incident and game day feeds the runbook, adding missing steps and removing stale ones.
Q9Solution ArchitectDesign
How do you prove readiness?
Prove it by exercise, with measurements, rather than by checking that documents exist. Run game days in which an engineer who did not build the service handles injected failures using only the alerts, dashboards and runbooks, and measure time to detect, time to reach the right person and time to resolve. Back this with coverage evidence: alert rules in the repository with test firing, a runbook link on every alert, runbooks exercised in the last six months, and the on-call schedule and escalation configured. A 30-minute readiness review checks the evidence before launch. ShopNow's pricing game day initially exposed a missing step and, after fixes, resolved in seven minutes.
Q10Solution ArchitectBehavioural
How do you keep on-call sustainable?
Keep pages few and meaningful, the rota large enough, and the load visible. Page only on symptom-based, actionable alerts, and route slow burns and cause-based signals to tickets and dashboards; aim for fewer than two pages a shift and under one night page a week per team. Keep at least six engineers in a rota, and use follow-the-sun across time zones for Tier 0 services so nobody is routinely woken. Track pages and out-of-hours work per person, review noisy alerts at every retro, and give recovery time after bad nights. Exhausted on-call engineers make slow, risky decisions, so sustainability is itself a reliability requirement.
Newsletter
Get new tutorials every week
New ArchitectMind tutorials and interview questions, once a week. No spam, unsubscribe anytime.
Your subscription could not be saved. Please try again.
Almost done! Check your inbox and click the confirmation link to complete your subscription.
 Architect