Chapter 1 — What Are Architecture Quality Attributes?
Prerequisites
Topic 1.1
You will be able to
Identify the architectural drivers of a system, separate constraints from negotiable drivers, explain why qualities force trade-offs, quantify business impact of qualities in money and risk, and use this to justify architectural decisions to business stakeholders
Covers
Architectural drivers · Constraints · Trade-offs · Business impact
Quality attributes matter because they are the main inputs that determine architecture and the main way architecture creates or destroys business value. Four ideas explain their importance:
Idea
Short definition
Architectural drivers
The small set of requirements that most shape the architecture: top quality scenarios, key functions, constraints, business goals and concerns
Constraints
Decisions already made that the architecture must honour
Trade-offs
Improving one quality usually costs another quality, money or time
Business impact
Qualities translate directly into revenue, cost, risk and speed
Table 1 — The four reasons QAs matter
Figure 1 — From business goals to architecture
2Why It Exists
Teams without explicit drivers tend to design by habit or fashion: every service gets Kafka, every database gets sharded, every page gets a cache — or, conversely, nothing is designed for peak until a sale fails. Explicit drivers, constraints and trade-offs make architecture a reasoned response to business needs.
Without drivers
With drivers
Technology-first debates
Scenario-first decisions
Everything "highly available"
Tiered availability by business value
Surprise costs
Cost of each quality is visible
Endless redesign
Decisions traced to reasons in ADRs
Table 2 — The difference drivers make
3Core Concepts
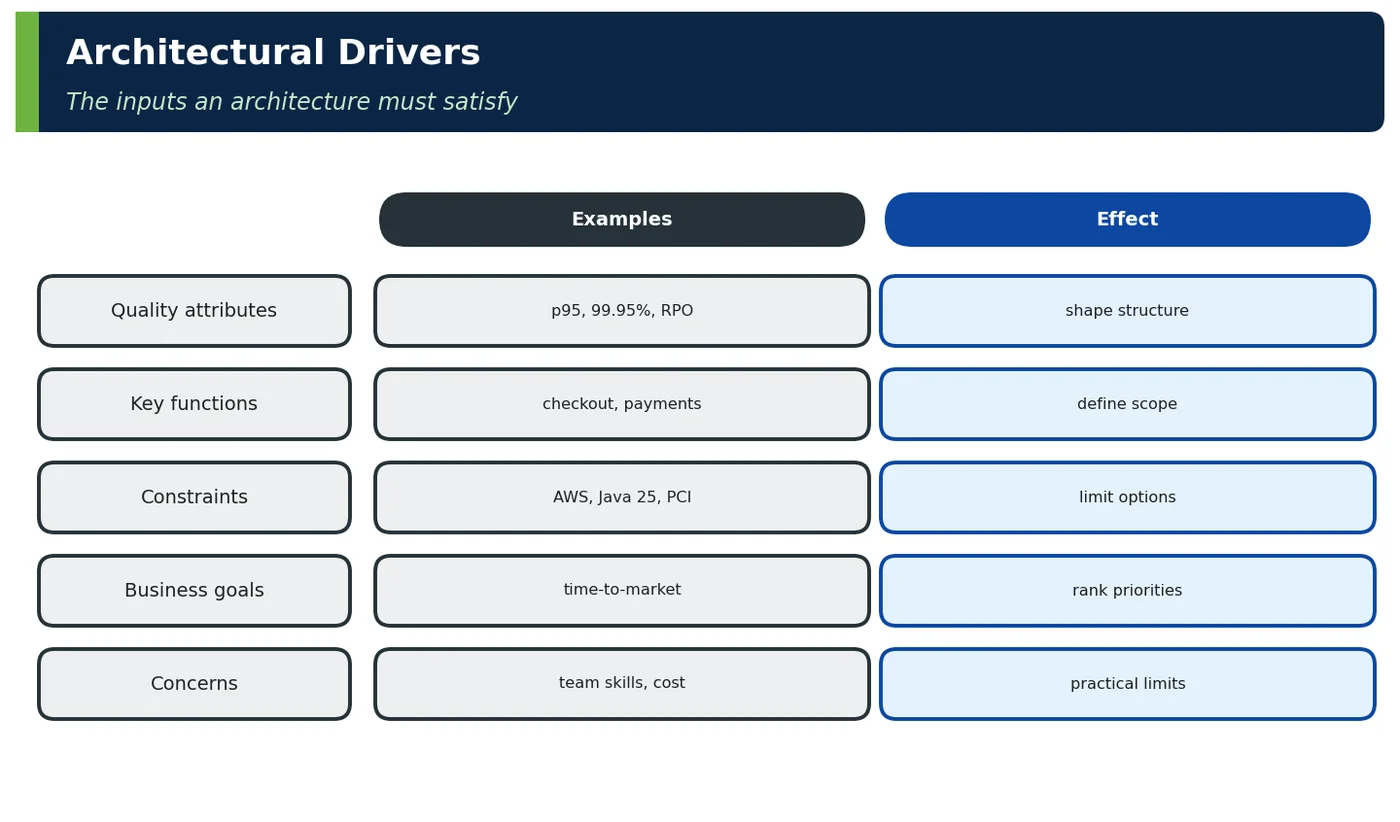
3.1 Architectural Drivers
Figure 2 — Architectural drivers
Driver category
ShopNow example
Top quality scenarios
Checkout p95 ≤ 800 ms at 1,500/s; 99.95% availability during sales; new payment rail ≤ 10 dev-days
Primary functions
Browse, search, checkout, pay, track order
Constraints
AWS ap-south-1, Java 25, PCI-DSS, card data never stored
Business goals
Grow GMV 40% this year; cut time-to-market for campaigns to 1 week
Architectural concerns
Team skills in Kafka are thin; migration from legacy Oracle
Table 3 — ShopNow drivers
Property of a good driver list
Why
Short (5–10 items)
Focus design effort
Prioritised
Resolve conflicts
Measurable
Verify design
Owned by a stakeholder
Legitimacy for trade-offs
Table 4 — Good drivers
3.2 Constraints
Figure 3 — Constraints — decisions already made for you
Constraint
Source
Architectural consequence
Customer data stays in India
RBI / DPDP
Single-region primary + in-country DR (Mumbai + Hyderabad)
No PAN storage
PCI-DSS
Tokenisation via gateway; isolated payments account
Java 25 + Spring Boot 4
Enterprise standard
Framework choices limited; virtual threads available
Launch before Diwali
Business
Prefer managed services over self-built
6 SREs for 12 teams
Organisation
Favour managed platforms, strong automation
Table 5 — Constraints and their consequences
Constraint vs driver
Constraint
Driver
Negotiable?
No (or only at executive level)
Yes, by priority
Example
Data in India
p95 ≤ 800 ms
Design treatment
Honour
Optimise and trade
Table 6 — Treat them differently
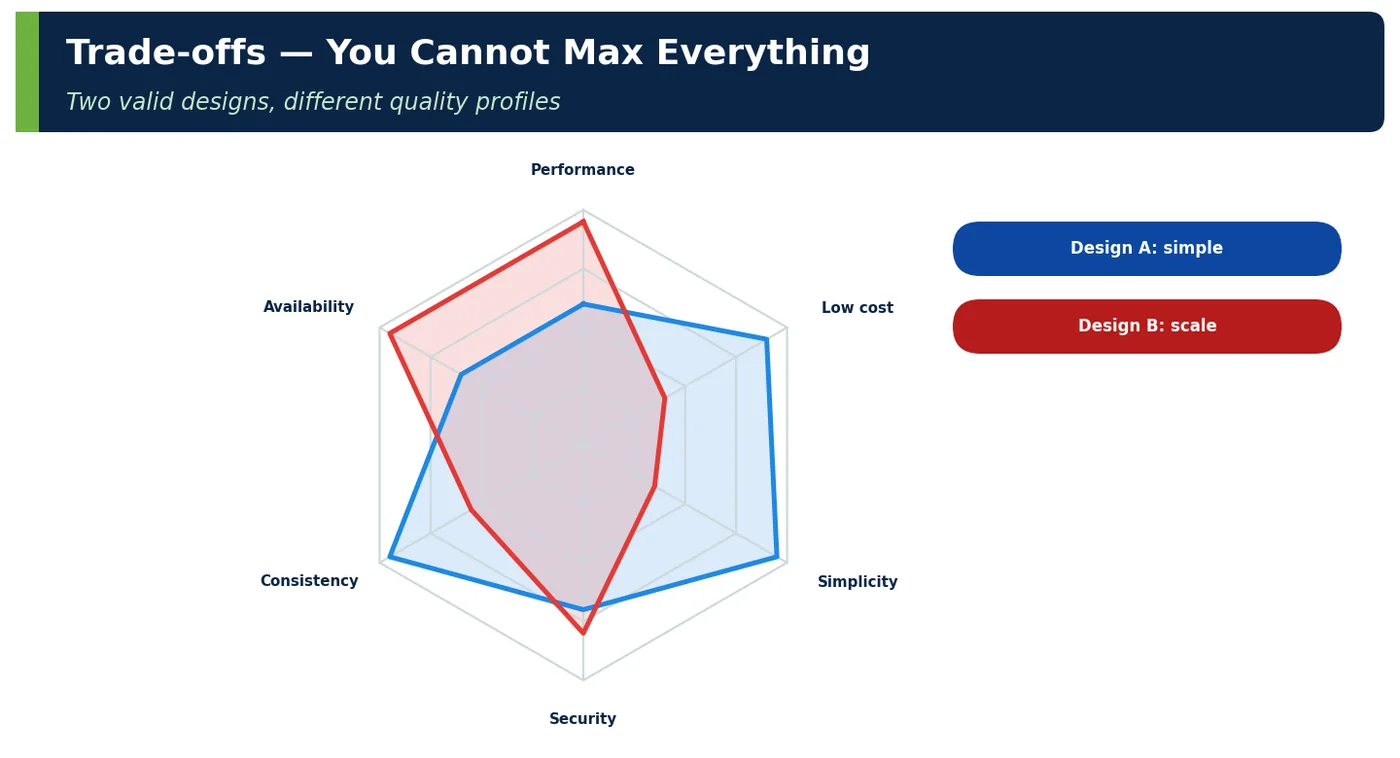
3.3 Trade-offs
Figure 4 — Trade-offs — you cannot max everything
Tactic
Improves
Costs
Cache product prices 60 s
Performance, DB load
Freshness (consistency)
Multi-AZ active–active
Availability
Cost (+ ~70%), complexity
Encryption with per-field keys
Security
Latency, key management
Microservices
Deployability, team scale
Operability, consistency
Synchronous replication across regions
RPO = 0
Write latency +30 ms
Table 7 — Every tactic has a price
ATAM term
Meaning
Example
Sensitivity point
A decision that strongly affects one quality
Cache TTL affects freshness
Trade-off point
A decision affecting two or more qualities in opposite directions
The more expensive option is cheaper once the business impact of the quality is included. This is the argument pattern Solution Architects use most often.
Numbers you need
Source
Revenue per hour (normal/peak)
Finance, analytics
Conversion sensitivity to latency
A/B tests, RUM data
Incident frequency and duration
Incident history, cloud SLAs
Regulatory penalties
Legal/compliance
Engineering cost
Delivery leads
Table 13 — Inputs for impact analysis
5APIs / Features / Syntax — Recording Drivers and Trade-offs
MARKDOWN
# ADR-0042: Aurora Multi-AZ with RDS Proxy for checkout## Drivers- QR-03 availability 99.95% for checkout during sales (H,H)- Constraint: data resides in ap-south-1## DecisionAurora PostgreSQL Multi-AZ, RDS Proxy for fast failover.## Trade-offs+ RTO ≈ 30 s, RPO ≈ 0 − +₹35 L/yr − brief write errors during failover## Business impactExpected avoided downtime cost ≈ ₹3.4 Cr/yr (see decision brief)
YAML
# drivers.yaml — the short, prioritised list reviewed every quarterdrivers: - id: QR-03 attribute: availability target: "99.95% checkout, rolling 30 days" priority: { business: H, risk: H } - id: QR-07 attribute: performance target: "p95 <= 800 ms at 1,500 checkouts/s" priority: { business: H, risk: M } - id: QR-12 attribute: modifiability target: "new payment rail <= 10 dev-days" priority: { business: M, risk: H }constraints: [ "data in India", "no PAN storage", "Java 25 / Spring Boot 4" ]
6Practical Examples
6.1 ShopNow: the business case for a CDN
The team wanted a CDN; finance asked why. RUM data showed product-page p95 of 1.9 s on mobile. Using the conversion sensitivity (≈ 1% per 100 ms), bringing p95 to 700 ms was worth ≈ 12% more conversions on mobile. The CDN cost ₹6 L/month; the uplift was worth ≈ ₹90 L/month. Approved in one meeting.
6.2 A constraint changes the architecture
Legal confirmed that order data must stay in India. The DR plan moved from Singapore to Hyderabad (ap-south-2), and cross-region replication was switched to in-country only.
Before
After
DR in ap-southeast-1
DR in ap-south-2
S3 CRR to Singapore
CRR to Hyderabad
Table 14 — Constraint-driven change
6.3 A trade-off made explicit
Pricing wanted real-time prices; catalogue wanted p95 ≤ 300 ms. The agreed trade-off: cache prices 30 s for browsing; re-price at checkout from the source of truth.
Quality
Browsing
Checkout
Performance
Cached, fast
Slower (+40 ms)
Consistency
≤ 30 s stale
Exact
Table 15 — Different trade-offs on different paths
6.4 Worked example — driver list for a new service
Driver
Priority
Refund within 5 min of return scan, 99.9%
H
Refunds idempotent (no double refunds)
H
New refund channel ≤ 1 week
M
Runs on existing EKS platform (constraint)
—
Table 16 — Refunds service drivers
6.5 Worked example — sensitivity point
Decision
Quality affected
Sensitivity
Kafka acks=all, min ISR 2
Durability vs latency
+4 ms p99 per event
HikariCP pool size
Throughput vs DB CPU
Knee at ~20 connections
Table 17 — Sensitivity points
6.6 Worked example — expressing impact in an interview
Question
Answer pattern
"Why multi-AZ?"
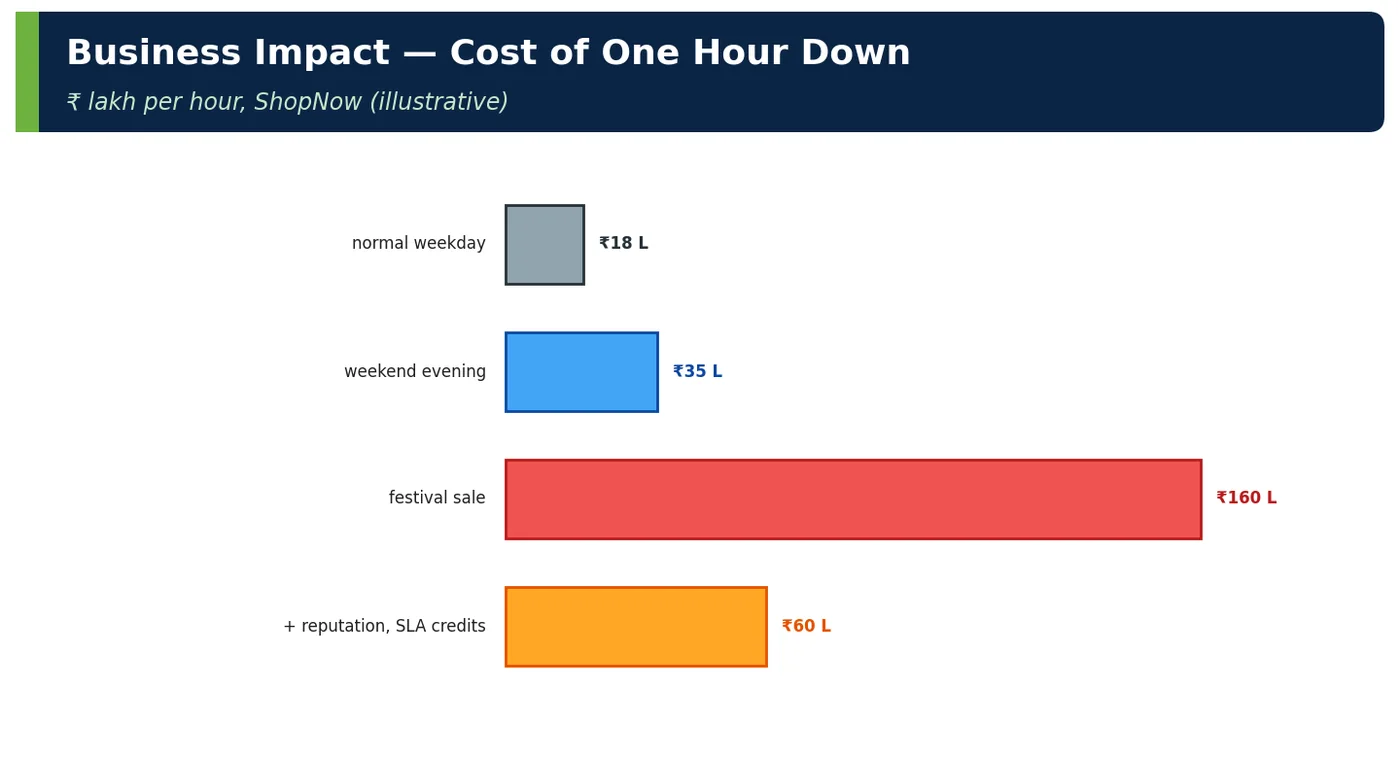
"Checkout downtime at peak costs ≈ ₹1.6 Cr/hour. Multi-AZ adds ₹35 L/year and cuts expected downtime by ~7 hours/year — a clear return."
Table 18 — Business framing
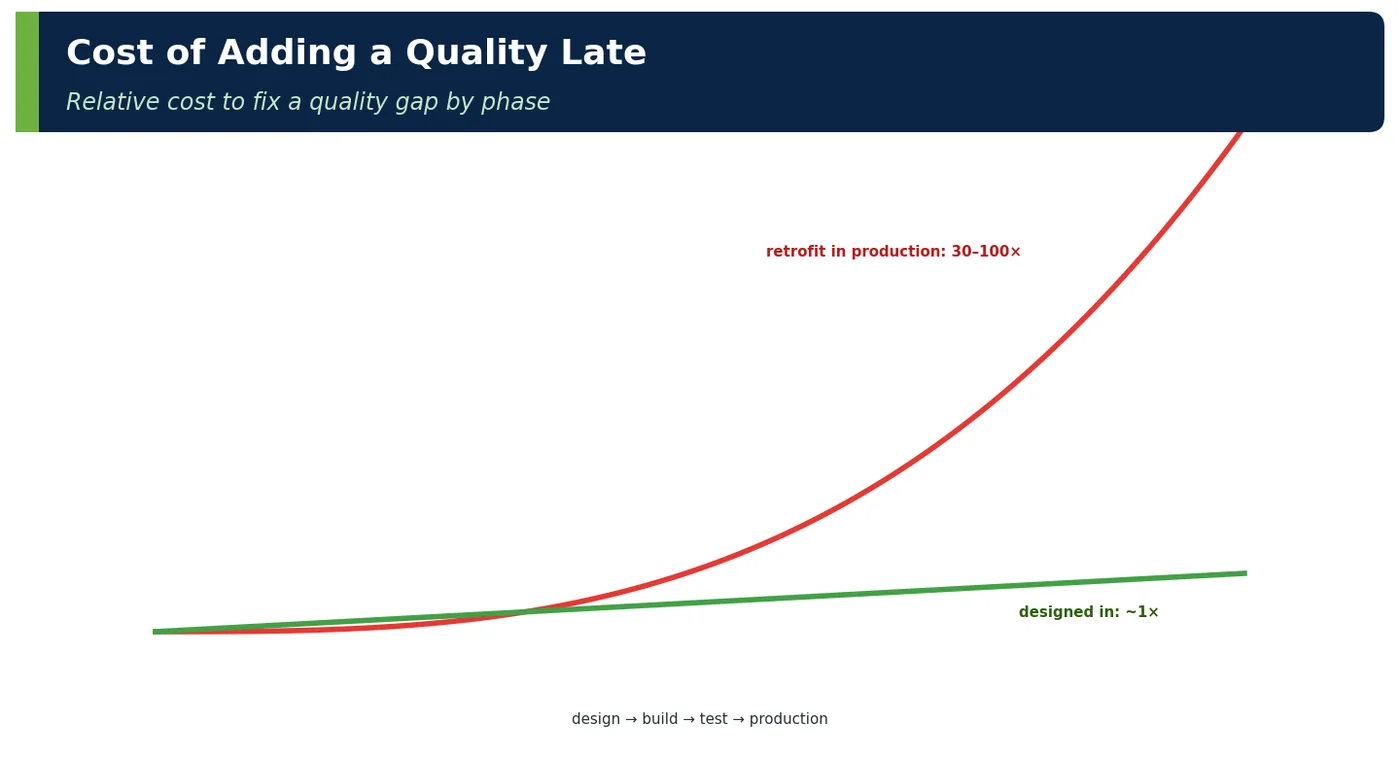
6.7 Worked example — cost of late quality
Quality gap found
When
Cost
No idempotency in payments
Design review
2 days
Same gap
Load test
3 weeks (refactor + data fix)
Same gap
Production (double charges)
Refunds, RBI complaint, 2 months
Table 19 — The same gap, found at different times
7Common Problems & Mistakes
Mistake
Consequence
Fix
Treating preferences as constraints
Options closed too early
Ask "who decided and can it change?"
Too many drivers
No focus
Keep 5–10, prioritised
Hiding trade-offs
Surprises later
Record them in ADRs
Arguing quality in technical terms only
Business says no
Translate into revenue, cost, risk
Ignoring constraint costs
Overruns
Price compliance and localisation
Table 20 — Mistakes and fixes
8Performance & Production Considerations
Consideration
Practice
Validate impact assumptions
Compare predicted vs actual incident cost each quarter
Revisit drivers before big events
Sale-readiness review
Monitor trade-offs
Track cache staleness complaints, failover errors
Constraint changes
Regulatory watch list owned by compliance
Table 21 — Operating with drivers
Drivers and impact estimates are not set once at design time; they drift as traffic, prices and regulations change. Close the loop after every significant incident by comparing the actual cost, in lost orders, SLA credits and engineering hours, with the figure assumed in the decision brief, and adjust the hourly downtime rates that finance supplies. Before each major sale, run a readiness review against the driver list: confirm that the peak scenario still matches the marketing forecast and that each trade-off is still acceptable at that volume, for example a 30-second price cache when prices change hourly during a flash sale. Instrument the cost side of trade-offs too, such as complaints about stale prices or write errors during failover, so the business sees both sides of each decision rather than only the benefit.
9Architecture & Design Considerations
Guideline
Detail
Start every design with drivers
One slide: top scenarios, constraints, goals
Prefer reversible decisions where drivers are uncertain
Two-way doors
Make trade-offs path-specific
Different qualities for browse vs checkout
Speak money
Decision briefs with risk-adjusted cost
Table 22 — Design guidance
10Interview Questions & Answers
Q1BasicConcept
What is an architectural driver?
An architectural driver is a requirement that shapes the architecture far more than an ordinary requirement does, so that getting it wrong would force a different structure. Drivers come from five sources: the top quality-attribute scenarios, the primary functions, constraints, business goals and architectural concerns such as thin team skills or a legacy migration. At ShopNow, checkout p95 of 800 ms at 1,500 requests per second and 99.95% availability during sales are drivers; the layout of the order-history page is not. A good driver list is short, five to ten items, prioritised, measurable and owned by a stakeholder, and every major decision in an ADR should trace back to one of them.
Q2BasicConcept
How is a constraint different from a quality requirement?
A constraint is a decision that has already been made, by a regulator, the enterprise or the business, and the architecture must honour it; a quality requirement is a measurable target that the architecture optimises and may trade against other targets. Keeping customer data in India under RBI and DPDP rules is a constraint: nobody on the project can negotiate it, so the DR region moves to Hyderabad instead of Singapore. Checkout p95 under 800 ms is a quality requirement: it can be prioritised, relaxed on non-critical paths or balanced against cost. Mixing them up is costly, because treating mere preferences as constraints closes good options far too early.
Q3IntermediateConcept
Why do quality attributes force trade-offs?
Quality attributes force trade-offs because every tactic that improves one quality consumes something another quality needs: CPU, latency budget, money, simplicity or consistency. Caching product prices for 60 seconds improves performance and database load but costs freshness. Running Multi-AZ active-active improves availability but adds roughly 70% to infrastructure cost and more operational complexity. Encrypting fields with per-field keys strengthens security but adds latency and key management. Because the qualities compete for the same finite resources, you cannot maximise all of them at once. The architect's job is not to avoid trade-offs but to choose them deliberately, per path, against prioritised drivers, and to record them in ADRs.
Q4IntermediateConcept
What is a sensitivity point?
A sensitivity point, in ATAM terms, is a design decision or parameter to which one quality attribute responds strongly, so a small change in it produces a large change in that quality. A cache TTL is the classic example: moving from 30 to 300 seconds dramatically changes data freshness. A HikariCP pool size is another: throughput rises until about 20 connections and then database CPU becomes the limit. Identifying sensitivity points tells you which settings deserve load tests, monitoring and change control. When the same decision affects two qualities in opposite directions, it becomes a trade-off point, which needs explicit agreement from stakeholders rather than quiet tuning by one team.
Q5Senior EngineerTrade-off
Give a trade-off point in a real system.
Replication mode for a payments database is a clear trade-off point. Synchronous replication across regions gives an RPO of zero, because no committed transaction can be lost, but every write waits for the remote acknowledgement, adding roughly 30 ms of write latency in ShopNow's case. Asynchronous replication keeps writes fast but accepts seconds of data loss if a region fails. Another example is Kafka with acks=all and min.insync.replicas of 2: durability improves, but p99 publish latency rises by around 4 ms per event. The right answer depends on the drivers; for payments, durability usually wins, whereas for clickstream events lower latency and cost matter more.
Q6Senior EngineerEstimation
How do you quantify availability impact?
Multiply the revenue lost per hour of downtime by the expected hours of downtime per year, then add SLA credits, regulatory penalties, recovery effort and a reputational allowance, and compare the total with the cost of the tactic. Use different hourly rates for peak and normal periods, because an hour on a sale day can cost ten times more. At ShopNow a single-AZ database costs ₹40 lakh a year but risks about eight hours of downtime, worth roughly ₹4.3 crore; Multi-AZ costs ₹75 lakh with about one hour expected, worth ₹0.5 crore. The inputs come from finance, incident history and cloud SLAs, and should be revalidated every quarter.
Q7Technical ArchitectDesign
How many drivers should a design have?
Typically five to ten, prioritised. Drivers exist to focus design effort and to settle conflicts, and a list of thirty requirements does neither: everything looks important, so nothing guides a decision. Start from the full scenario catalogue, rank each scenario by business importance and technical risk in a utility tree, and promote only the high-high items plus the hard constraints and key functions. The rest still matter, but they are handled by standard platform practices rather than by the structure of the architecture. Review the list every quarter and before big events, because a new regulation or growth target can promote a scenario into the driver set.
Q8Technical ArchitectScenario
How do you handle a constraint that hurts a key quality?
First, check that it really is a constraint: ask who imposed it and whether it can change, because many so-called constraints are preferences. If it is genuine, quantify what it costs the quality in business terms, for example extra latency or lower availability expressed in rupees per year, and take that evidence to the constraint's owner. They may relax it, fund a mitigation or accept the consequence. If it stands, design the best option within it, such as in-country DR in Hyderabad when data must stay in India, and record the constraint, the impact and the decision-maker in an ADR, so the consequence stays visible later.
Q9Solution ArchitectBehavioural
How do you justify a more expensive architecture?
Show the risk-adjusted cost rather than the price tag. Put each option's annual cost next to its expected losses, downtime hours multiplied by revenue per hour, plus penalties and incident effort, and add any revenue it gains, such as conversion from lower latency. At ShopNow, Multi-AZ adds ₹35 lakh a year but avoids about ₹3.4 crore of expected downtime cost, so the expensive option is cheaper overall. Tie the argument to a business goal the sponsor already owns, use finance's numbers rather than your own, and present it as a one-page decision brief. Stakeholders approve returns on investment; they rarely approve architecture for its own sake.
Q10Solution ArchitectConcept
Why is finding a quality gap late so expensive?
Quality attributes are structural: they come from how components, data and interactions are arranged, not from a few lines of code. A missing quality found late therefore means changing structure that other work has been built on, often along with data, contracts and operational processes. ShopNow's missing payment idempotency would have cost two days to fix in design review and three weeks after a load test, including refactoring and data fixes. Found in production, it meant double charges, refunds, an RBI complaint and two months of work. This is why architects state quality scenarios early, test them with prototypes and load tests, and review designs before building.
Newsletter
Get new tutorials every week
New ArchitectMind tutorials and interview questions, once a week. No spam, unsubscribe anytime.
Your subscription could not be saved. Please try again.
Almost done! Check your inbox and click the confirmation link to complete your subscription.
 Architect