Build and name a capability map, assess capabilities to create heat maps, map capabilities to applications and gaps, derive bounded contexts, service and team boundaries, classify core versus generic capabilities for sourcing, and use capability-based planning for roadmaps
A business capability is what an organisation does — or needs to be able to do — to achieve its objectives, independent of how (process), who (organisation) or with what (applications). Capabilities are stable: an insurer has always needed to "assess claims", whether by surveyors with paper forms or by AI on photos. A capability map organises capabilities hierarchically and becomes the backbone for investment decisions, application rationalisation and service boundaries.
Figure 1 — Business capability map — claims domain
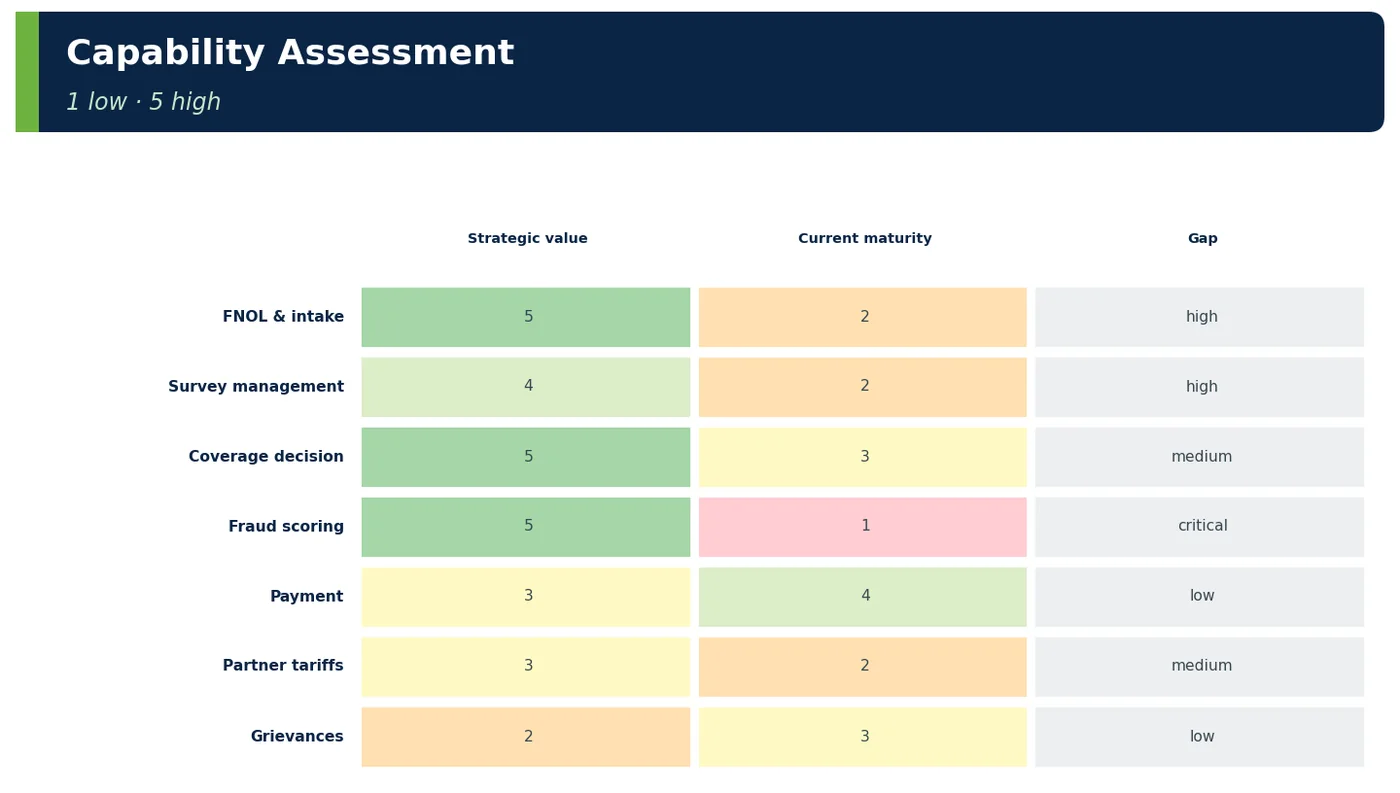
Figure 2 — Capability assessment
Vocabulary
Meaning
Capability
Ability to achieve an outcome ("Claim assessment")
Process
Sequence of activities using capabilities
Value stream
End-to-end value delivery crossing capabilities
Core / supporting / generic
Differentiating vs necessary vs commodity (DDD)
Table 1 — Terms
2Why It Exists
Problem
Capability-based answer
Investment spread thinly
Heat map shows strategic gaps
Five systems doing "customer notification"
Capability-to-application map exposes redundancy
Services cut by technical layers
Capability-aligned boundaries
Reorganisations break systems
Capabilities stable across org changes
Table 2 — Why
3Core Concepts — Building the Map
Rule
Example
Noun + noun or noun + verb-ing
"Claim assessment", not "Assess claims process"
MECE at each level
Siblings don't overlap, together complete
L1 = broad domains, L2 = capabilities, L3 = detail only where needed
Claims → Claim assessment → Medical review
Independent of org and systems
No "SAP billing", no "Pune hub"
Use reference models as a start
ACORD (insurance), BIAN (banking)
Table 3 — Mapping rules
4How It Works Internally — Assessing Capabilities
Dimension
Question
Scale
Strategic importance
Does it differentiate or drive goals?
1–5
Maturity
Process, data, technology quality today
1–5
Performance
KPIs vs target
Red/amber/green
Gap
Importance − maturity
Priority
Application coverage
Which systems support it; duplication
List
Table 4 — Heat-map inputs
4ADeep Dive — Capability to Application Mapping
Capability
Applications today
Finding
FNOL & intake
Call centre CRM, legacy claims, email
Fragmented, manual re-keying
Survey management
Excel + email
No system
Coverage decision
Legacy claims (rules in code)
Rules hard to change
Fraud scoring
None (manual referrals)
Critical gap
Payment
Finance ERP
Adequate
Table 5 — Gaps and redundancies
4BDeep Dive — Core, Supporting, Generic
Type
Kavach examples
Sourcing implication
Core (differentiating)
Coverage decision, fraud scoring, FNOL experience
Build or buy + heavy extension
Supporting
Survey management, partner tariffs
Build simply or configure a product
Generic
Payments, notifications, document storage
Buy / SaaS / managed
Table 6 — Feeds build vs buy (Topic 3.3)
4CDeep Dive — From Capabilities to Architecture Boundaries
Figure 3 — Capabilities → services → teams
Step
Detail
Group L2 capabilities with high cohesion
Intake + FNOL + document capture
Validate with event storming
Events and language consistent within group
Define bounded context
One model, one language
Assign ownership
Stream-aligned team per context
Define contracts
APIs and events between contexts
Table 7 — Capability-aligned design
4DDeep Dive — Capability-Based Planning
Horizon
Capabilities uplifted
Release 1 (6 months)
Digital FNOL, document capture, status tracking
Release 2 (12 months)
Automated assessment, fraud scoring v1
Release 3 (18 months)
Cashless partner integration, recovery
Table 8 — Roadmap by capability, not by system
4EDeep Dive — Pitfalls
Pitfall
Correction
Map mirrors the org chart
Name what, not who
Process names ("Approve claim")
Ability nouns
Too deep everywhere
L3 only where investment decisions need it
Map built by IT alone
Co-create with business owners
Never used
Link to portfolio and roadmap decisions
Table 9 — Keep maps useful
5APIs / Features / Syntax
YAML
# Capability map as data (versioned, used to generate heat maps and ownership reports)capabilities: - id: CAP-CL-01 name: Claim intake level: 1 children: - {id: CAP-CL-01.1, name: First notice of loss, importance: 5, maturity: 2} - {id: CAP-CL-01.2, name: Document capture, importance: 4, maturity: 2} - {id: CAP-CL-01.3, name: Policy verification, importance: 4, maturity: 3} - id: CAP-CL-04 name: Fraud and risk level: 1 type: core children: - {id: CAP-CL-04.1, name: Fraud scoring, importance: 5, maturity: 1} owner_team: team-fraud applications: [] # gap: no system today
JAVA
// Capability-aligned module boundaries enforced in code (Spring Modulith)@ApplicationModule(displayName = "Claim intake", allowedDependencies = "shared")package com.kavach.claims.intake;// Architecture test: no module reaches into another module's internals@Testvoid modulesRespectCapabilityBoundaries() { ApplicationModules.of(ClaimsApplication.class).verify();}
TEXT
Capability → application heat map (excerpt, generated)Capability Importance Maturity Gap ApplicationsFirst notice of loss 5 2 HIGH CRM, legacy-claims, emailSurvey management 4 2 HIGH (spreadsheets)Fraud scoring 5 1 CRIT —Payment 3 4 LOW finance-erp
6Practical Examples
6.1 Kavach claims map
The claims domain produced 6 L1 and 23 L2 capabilities. The heat map pointed investment at fraud scoring (importance 5, maturity 1), FNOL and survey management; payments were adequate and left untouched.
6.2 NovaBank BIAN alignment
NovaBank started from BIAN service domains, trimmed to 140 relevant ones, and used them to identify seven redundant "customer notification" implementations to consolidate.
6.3 ShopNow Global
Market expansion was planned as capability uplifts per market (local payments, tax calculation, localisation), revealing that "tax calculation" was a generic capability best bought.
6.4 Worked example — naming
Wrong
Right
"Claims hub operations"
Claim assessment
"Approve claim"
Coverage decision
Table 10 — Rules applied
6.5 Worked example — gap scoring
Capability
Importance
Maturity
Gap
Fraud scoring
5
1
4
Table 11 — Priority
6.6 Worked example — redundancy
Capability
Systems
Customer notification
7 at NovaBank
Table 12 — Rationalisation
6.7 Worked example — interview whiteboard
Prompt
Answer outline
"How do you use capability maps in architecture?"
"Capabilities = what the business does, stable vs processes/org/systems. Build L1–L2 (L3 selectively), MECE, noun naming, from reference models (ACORD/BIAN) with business owners. Assess importance, maturity, performance → heat map for investment. Map applications to find gaps and redundancy. Classify core/supporting/generic for build vs buy. Group cohesive capabilities into bounded contexts, services and team ownership; enforce boundaries in code. Plan roadmap by capability uplift."
Table 13 — Structured answer
6.8 Worked example — bounded context
Capabilities grouped
Context
FNOL, document capture, policy verification
Intake
Table 14 — Boundary
6.9 Worked example — anti-patterns
Anti-pattern
Effect
Org-chart map
Breaks at reorg
Too detailed
Nobody maintains
IT-only
No business buy-in
Table 15 — Common mistakes
6.10 Worked example — reference model
Domain
Model
Insurance
ACORD capability model
Banking
BIAN service landscape
Table 16 — Starting points
6.11 Worked example — investment view
Colour
Meaning
Red
Invest now
Green
Sustain
Table 17 — Board communication
6.12 Worked example — value stream overlay
Stage
Capabilities used
Assess
Survey mgmt, coverage decision, fraud scoring
Table 18 — Cross-view
6.13 Worked example — ownership
Capability
Business owner
Team
Fraud scoring
CRO
Team Fraud
Table 19 — Accountability
6.14 Worked example — generic buy
Capability
Choice
Notifications
SaaS/managed
Table 20 — Sourcing
6.15 Worked example — capability KPIs
Capability
KPI
FNOL
% digital within 24 h
Table 21 — Performance
6.16 Worked example — interview follow-ups
Follow-up
Answer
"Capability vs process?"
What vs how
"How deep?"
L2 generally, L3 where investing
Table 22 — Common probes
6.17 Worked example — checklist
Item
✔
L1–L2 map
✔
Heat map
✔
App mapping
✔
Core/generic classified
✔
Boundaries derived
✔
Roadmap by capability
✔
Table 23 — Capability baseline
6.18 Worked example — enforcement
Tool
Use
Spring Modulith verify()
Boundaries in code
Table 24 — Guardrails
6.19 Worked example — legacy mapping
Legacy module
Capabilities covered
Claims EE app
Intake, assessment, settlement (monolith)
Table 25 — Strangler plan input
6.20 Worked example — portfolio
Project
Capability uplift
Doc AI
Document capture 2 → 4
Table 26 — Governance
6.21 Worked example — interview scenario
Question
Answer
"Where do microservice boundaries come from?"
Capabilities validated by domain events
Table 27 — Apply
6.22 Worked example — map maintenance
Cadence
Owner
Quarterly
Enterprise architecture
Table 28 — Keeping current
6.23 Worked example — merger use
Scenario
Use
Acquired insurer
Compare maps to plan integration
Table 29 — Strategic
6.24 Worked example — data ownership
Capability
Master data
Policy verification
Policy (read-only from PAS)
Table 30 — Data
6.25 Worked example — cost allocation
Capability
Run cost
Tagged services
Cost per capability
Table 31 — FinOps
6.26 Worked example — deliverables
Deliverable
Audience
Map, heat map, app mapping, roadmap
Board, architects
Table 32 — Outputs
7Common Problems & Mistakes
Mistake
Fix
Process naming
Nouns
Org mirroring
What not who
Unused map
Link to decisions
Over-detail
L2 default
Table 33 — Mistakes and fixes
Capability maps fail in predictable ways. The most common is naming capabilities after processes or departments, so the map reads "Approve claim" or "Pune hub operations" and has to be redrawn after every reorganisation or process change. The second is building the map in IT alone: without business owners scoring importance and maturity, the heat map reflects engineers' frustrations rather than strategy, and nobody in the business trusts it. Teams also go too deep too early, producing hundreds of level-three boxes that nobody maintains, when level two is enough for most investment and boundary decisions. Finally, many maps are produced once for a strategy deck and never linked to portfolio funding, roadmaps or service ownership, so they quietly go stale.
8Performance & Production Considerations
Consideration
Practice
Capability KPIs
Dashboards
Cost per capability
Tagging
Ownership
Clear teams
Table 34 — Operating by capability
A capability map earns its keep in operation when it is connected to live data. Give every level-two capability a business owner, an owning team and one or two KPIs, such as the percentage of claims notified digitally within twenty-four hours, and show them on a dashboard so maturity scores are based on evidence rather than opinion. Tag cloud resources and services with capability IDs, which lets finance report run cost per capability and exposes expensive generic capabilities that should be bought instead. Keep the map as versioned data, as in the YAML example, and regenerate heat maps and ownership reports from it. Review it quarterly with enterprise architecture, and update it whenever a project closes, so the map shows today's maturity, not last year's.
9Architecture & Design Considerations
Guideline
Detail
Boundaries from capabilities
Stable
Core vs generic
Sourcing
Heat maps
Investment
Table 35 — Design guidance
10Interview Questions & Answers
Q1BasicConcept
What is a business capability?
A business capability is something the organisation does, or needs to be able to do, to achieve its objectives, described independently of how it is done, who does it and which systems support it. Claim assessment, fraud scoring and payment are capabilities for an insurer; the process, the team and the application behind each can all change while the capability stays. Capabilities are named as nouns describing an ability, and organised in a hierarchy from broad level-one domains to level-two capabilities and selective level-three detail. That stability is why architects use the capability map as the backbone for investment decisions, application rationalisation, service boundaries and team ownership.
Q2BasicConcept
Capability vs process?
A capability is what the business is able to do; a process is how work flows through a sequence of activities that uses one or more capabilities. Claim assessment is a capability. The motor claims process, from first notice of loss through survey, assessment, approval and payment, is a process that draws on intake, survey management, coverage decision, fraud scoring and payment capabilities in turn. Processes change frequently, through automation, regulation or reorganisation, while capabilities remain. Value streams sit above processes as end-to-end views of customer value. For architecture, capabilities are better anchors for service boundaries, because boundaries drawn around processes break every time the process is redesigned.
Q3IntermediateConcept
How are capability maps structured?
A capability map is a hierarchy. Level one holds broad domains such as Claims or Fraud and risk; level two breaks each into capabilities such as First notice of loss, Document capture and Policy verification; level three adds detail only where an investment decision needs it. Siblings at every level should be MECE, mutually exclusive and collectively exhaustive, so they do not overlap and together cover the parent. Names are nouns describing abilities, never departments, processes or systems. Starting from a reference model such as ACORD for insurance or BIAN for banking saves time, but it must be trimmed with business owners: NovaBank used 140 of BIAN's service domains, not all of them.
Q4IntermediateConcept
What is a capability heat map?
A capability heat map colours each capability on the map according to an assessment, so investment priorities become visible at a glance. The usual dimensions are strategic importance and current maturity, each scored from one to five with business owners, plus performance against KPIs as red, amber or green. The gap between importance and maturity is what matters most: a capability with importance five and maturity one is a critical investment target. Kavach's claims map showed fraud scoring with no supporting system at all, alongside FNOL and survey management, while payment scored adequate and was left alone. It turns a vague request for modernisation into a focused, defensible investment case.
Q5Senior EngineerDesign
How do capabilities relate to microservices?
Capabilities give microservice boundaries a stable business basis. You group level-two capabilities with high cohesion, those that share data, language and change together, such as FNOL, document capture and policy verification, into a candidate bounded context, and then validate the grouping with event storming to check that events and terms are consistent within it. Each bounded context gets one model, one ubiquitous language, a stream-aligned owning team and explicit API and event contracts with its neighbours. It may become one service or a module of a modular monolith; Kavach enforces such module boundaries with Spring Modulith verification. Boundaries drawn this way survive reorganisations far better than ones cut by technical layers.
Q6Senior EngineerConcept
Why are capabilities stable?
Capabilities are stable because the business need behind them persists even when everything that delivers it changes. An insurer has always needed to assess claims, whether through surveyors with paper forms, a call centre with a legacy claims system, or AI analysing photos uploaded from a phone. Processes are redesigned, departments are reorganised and applications are replaced, but the ability to assess a claim remains. That is why capability names deliberately avoid processes, teams and systems. For architects, stability is the whole point: service boundaries, data ownership and team responsibilities anchored to capabilities need far less rework when the organisation or technology inevitably changes.
Q7Technical ArchitectTrade-off
How do core and generic capabilities differ?
Core capabilities differentiate the business and directly drive its strategy; generic capabilities are commodities every organisation needs and nobody wins by doing better. Supporting capabilities sit between, necessary and specific to the business but not differentiating. The classification comes from domain-driven design and drives sourcing. At Kavach, coverage decision, fraud scoring and the FNOL experience are core, so they are built in-house or bought and heavily extended, with the best engineers and the cleanest architecture. Survey management is supporting, built simply or configured. Payments, notifications and document storage are generic, so they are bought as SaaS or managed services, which frees effort for the core.
Q8Technical ArchitectConcept
What does capability-to-application mapping reveal?
It reveals gaps, redundancy, fragmentation and legacy dependencies. Gaps are capabilities with no supporting system, such as fraud scoring at Kavach, which relied on manual referrals. Redundancy is several systems implementing the same capability, such as NovaBank's seven separate customer notification implementations, which become consolidation candidates. Fragmentation is one capability spread across systems, such as FNOL handled partly in a CRM, partly in the legacy claims application and partly by email, with manual re-keying between them. It also shows where business rules are locked inside legacy code. Combined with the heat map, the mapping turns into a prioritised list of rationalisation and modernisation work with clear business justification.
Q9Solution ArchitectDesign
How use capabilities for roadmaps?
Express the roadmap as capability uplifts rather than projects or technologies. Each release states which capabilities will move from one maturity level to another and which KPI will prove it. Kavach's plan puts digital FNOL, document capture and status tracking in release one at six months, automated assessment and fraud scoring version one in release two, and cashless partner integration and recovery in release three at eighteen months. The heat map sets the order, dependencies between capabilities shape the sequence, and each project in the portfolio is tagged with the capability it uplifts. This keeps business sponsors and engineers aligned on outcomes, and makes it easy to drop work that uplifts nothing important.
Q10Solution ArchitectConcept
Which reference models help?
Industry reference models give a vetted starting point and a shared vocabulary. In insurance, ACORD's capability and information models describe what an insurer does, from policy administration to claims and reinsurance. In banking, BIAN, the Banking Industry Architecture Network, defines a service landscape of several hundred service domains, from customer offer to payment execution, that maps well onto capabilities and service boundaries. Other domains have frameworks such as TM Forum's eTOM for telecoms, and general frameworks such as TOGAF and the Business Architecture Guild's BIZBOK describe how to build capability maps. Use them as a checklist and vocabulary, then trim and adapt with business owners; copying the whole model produces an unusable map.
Newsletter
Get new tutorials every week
New ArchitectMind tutorials and interview questions, once a week. No spam, unsubscribe anytime.
Your subscription could not be saved. Please try again.
Almost done! Check your inbox and click the confirmation link to complete your subscription.
 Architect