 Architect

- Chapter
- Chapter 1 — System Design Thinking
- Prerequisites
- Books 7 and 9
- You will be able to
- Explain what system design is, follow a repeatable design process, reason at the right level of abstraction, use standard building blocks, document designs with appropriate artefacts, and evaluate trade-offs explicitly
- Covers
- What is system design
On this page
- 1. Concept / Definition
- 2. Why It Exists
- 3. Core Concepts — Scope of System Design
- 4. How It Works Internally — The Design Process
- 4A. Deep Dive — Building Blocks
- 4B. Deep Dive — Levels of Abstraction
- 4C. Deep Dive — Trade-off Thinking
- 4D. Deep Dive — Artefacts
- 4E. Deep Dive — Evaluating a Design
- 5. APIs / Features / Syntax
- 6. Practical Examples
- 7. Common Problems & Mistakes
- 8. Performance & Production Considerations
- 9. Architecture & Design Considerations
- 10. Interview Questions & Answers
1Concept / Definition
System design is the process of defining a system's components, their interfaces, the data they own and exchange, and how they are deployed and operated so that the system meets its functional requirements and quality attributes within its constraints, while remaining able to evolve. It turns requirements into a structure — and every structural choice is a trade-off.
| Vocabulary | Meaning |
|---|---|
| Component | Deployable or logical unit with a responsibility |
| Interface | Contract between components (API, event, file) |
| Quality attribute | Measurable property (latency, availability, cost) |
| Trade-off | Gaining one quality at the expense of another |
2Why It Exists
| Without deliberate design | With it |
|---|---|
| Accidental architecture | Intentional structure |
| Scaling surprises | Capacity planned |
| Unclear ownership | Components with owners |
| Hard-to-change systems | Evolvable boundaries |
3Core Concepts — Scope of System Design
| Concern | Questions |
|---|---|
| Functionality | What must it do? |
| Structure | Which components and responsibilities? |
| Interfaces | How do components communicate (sync, async)? |
| Data | What is stored where, with what consistency? |
| Scale | How much traffic and data, how fast growing? |
| Reliability | What fails and how do we survive? |
| Security | Who can do what; how is data protected? |
| Operations | How is it deployed, observed, costed? |
| Discipline | Focus |
|---|---|
| Enterprise architecture | Portfolio, capabilities |
| Solution architecture | End-to-end solution for a business problem |
| System design | Structure of a specific system at scale |
| Software design | Code structure inside components |
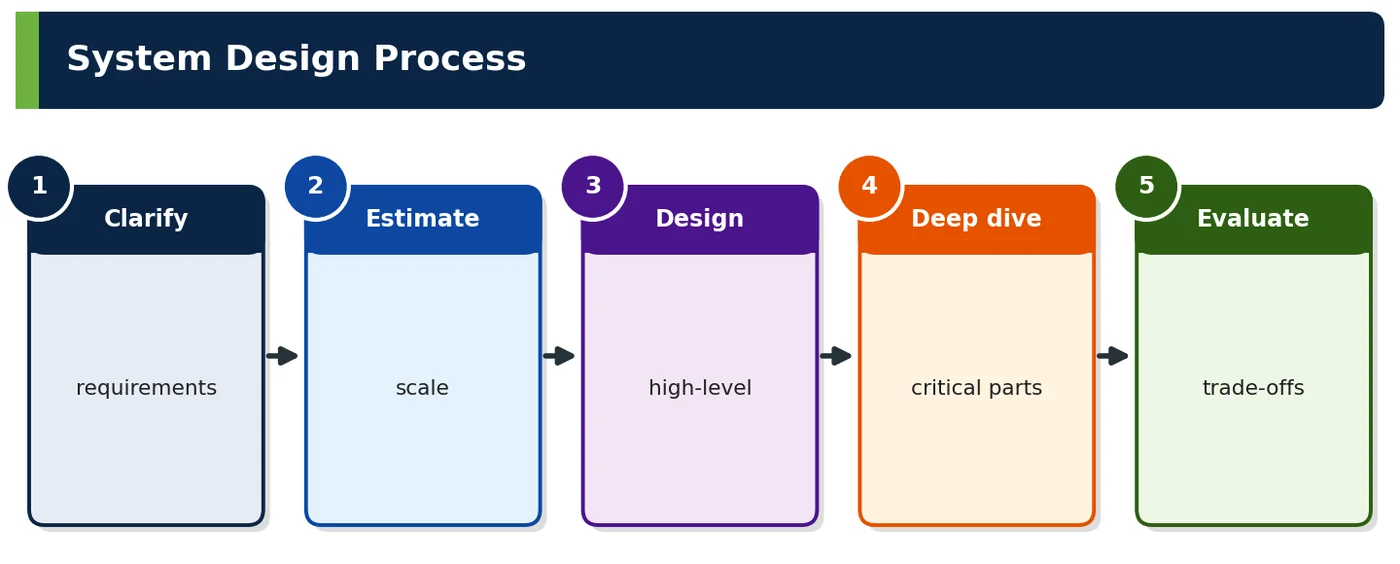
4How It Works Internally — The Design Process
| Step | Output (ShopNow order tracking) |
|---|---|
| Clarify | Customers track orders; NFRs: 50k RPS peak, p99 < 200 ms, 99.95% |
| Estimate | 72M requests/day, 25k peak QPS, 17 TB/yr events |
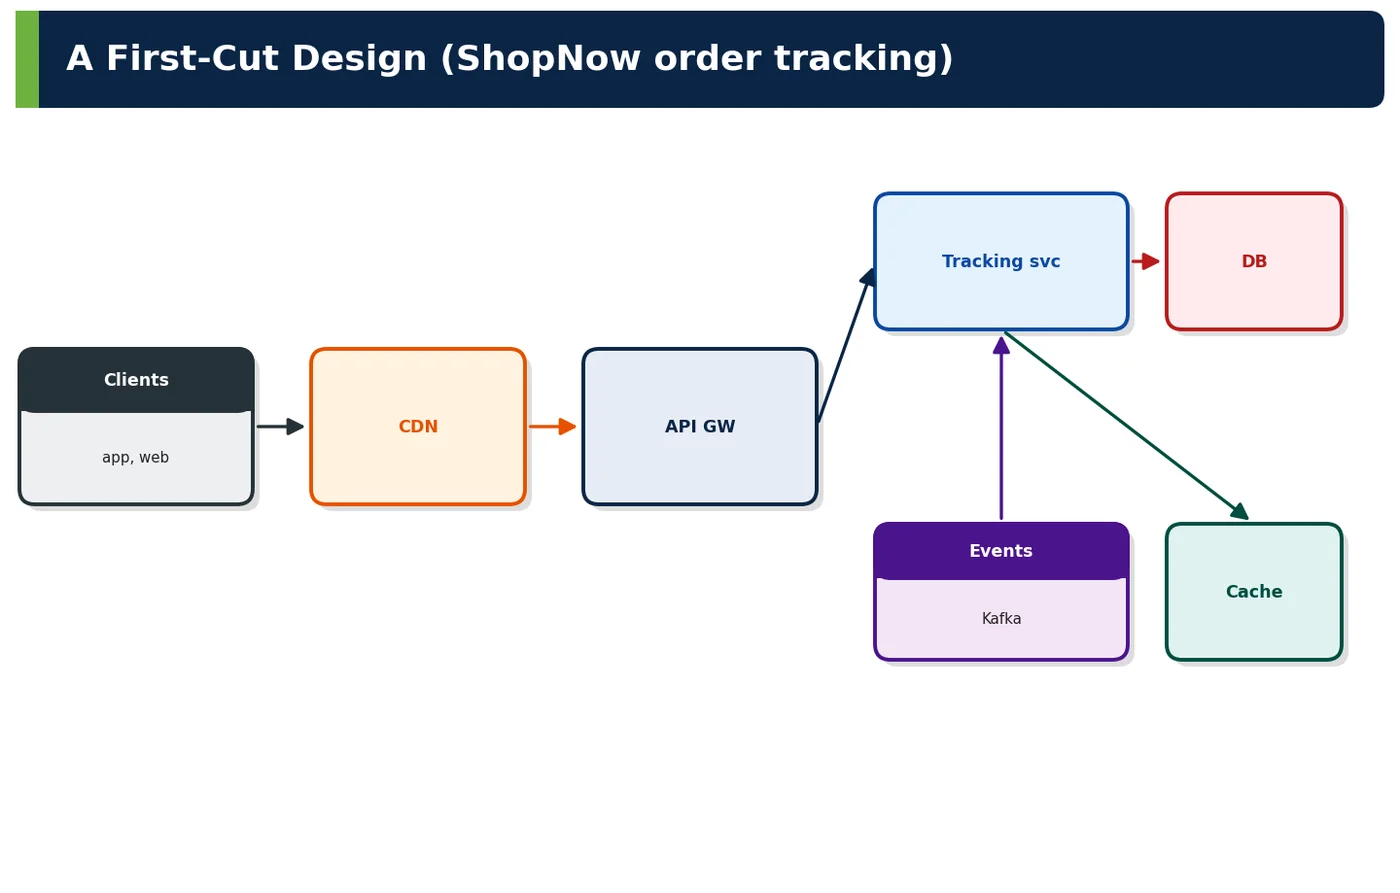
| High-level design | CDN → gateway → tracking service → cache + DB; carrier events via Kafka |
| Deep dives | Cache strategy, event ordering, hot orders, carrier webhook security |
| Trade-offs | Eventual consistency (≤ 5 s) for cheaper, faster reads |
| Iterate | Refine after load tests and reviews |
4ADeep Dive — Building Blocks
| Block | Role |
|---|---|
| CDN | Edge caching, static and cacheable API responses |
| Load balancer / gateway | Routing, TLS, auth, limits |
| Stateless services | Business logic, horizontal scaling |
| Cache | Low-latency reads, load shedding for DB |
| Database | System of record |
| Queue / stream | Decoupling, buffering, events |
| Object storage | Files, archives, data lake |
| Search index | Full-text, faceted queries |
| Workers / batch | Asynchronous processing |
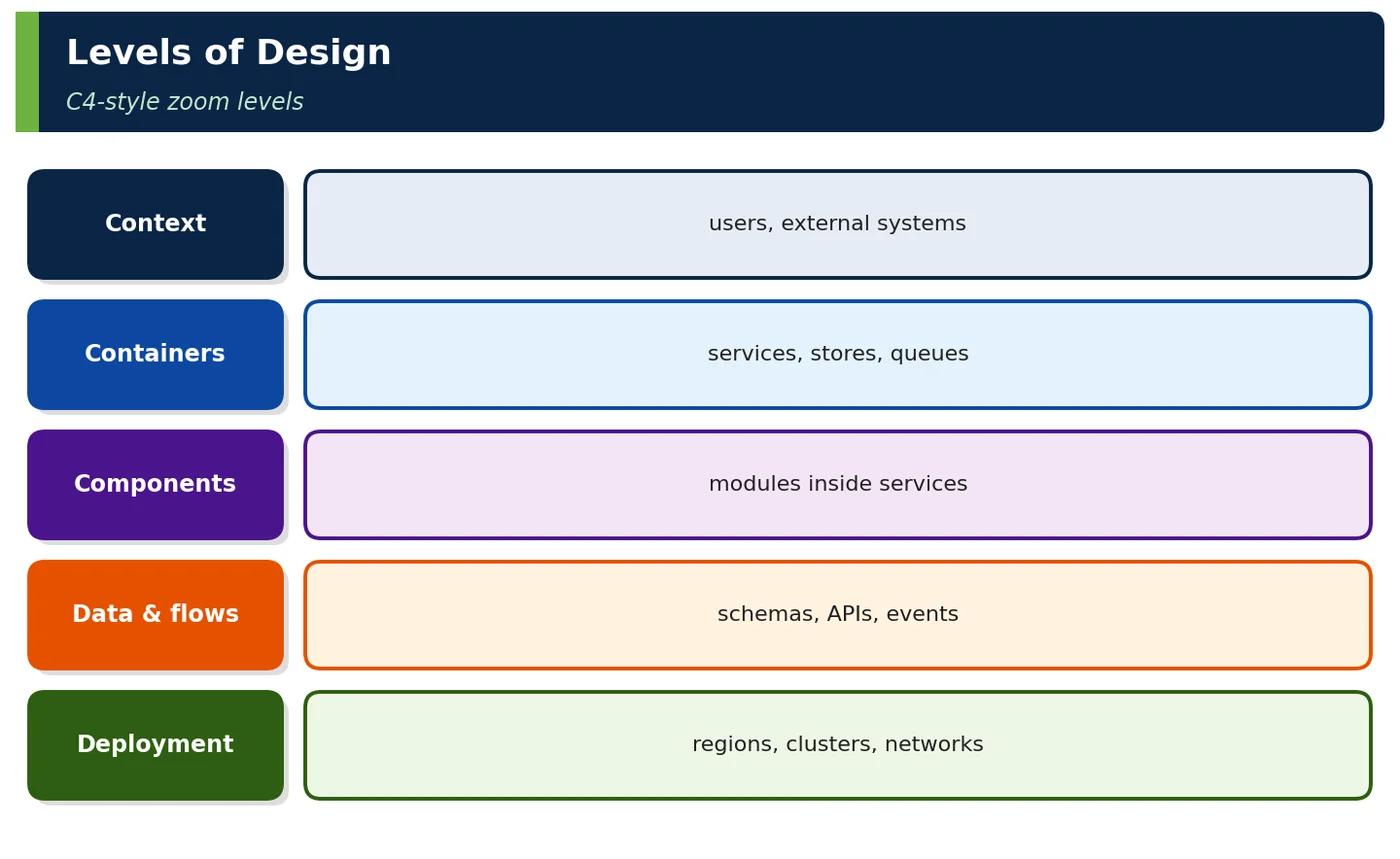
4BDeep Dive — Levels of Abstraction
| Level | Audience | Artefact |
|---|---|---|
| Context | Business, stakeholders | System context diagram |
| Containers | Architects, teams | Services, stores, queues |
| Components | Developers | Modules inside a service |
| Code | Developers | Classes (usually not drawn) |
| Deployment | Ops/SRE | Regions, clusters, networks |
4CDeep Dive — Trade-off Thinking
| Trade-off | Example decision |
|---|---|
| Latency vs consistency | Cache tracking status with 5 s freshness |
| Cost vs availability | Multi-AZ but single region for tracking |
| Simplicity vs flexibility | One service now, split later if needed |
| Throughput vs latency | Batch carrier updates every second |
| Build vs buy | Managed DynamoDB vs self-managed Cassandra |
4DDeep Dive — Artefacts
| Artefact | Purpose |
|---|---|
| Diagrams (C4, sequence, deployment) | Communicate structure and flows |
| ADRs | Record decisions and alternatives |
| API specifications (OpenAPI/AsyncAPI) | Contracts |
| Data models | Schemas, keys, access patterns |
| Capacity plan | Numbers from estimation |
| NFR catalogue | Measurable targets |
4EDeep Dive — Evaluating a Design
| Technique | Detail |
|---|---|
| Scenario walkthroughs | Trace key use cases and quality scenarios |
| Failure analysis | What if cache/DB/region fails? |
| Bottleneck analysis | Where does load concentrate? |
| ATAM-lite | Sensitivity points, trade-offs, risks |
| Cost estimate | Monthly run cost at expected load |
5APIs / Features / Syntax
// Design intent in code: tracking read path reflects the chosen trade-off (cache first)
@GetMapping("/orders/{id}/tracking")
TrackingView tracking(@PathVariable String id, @AuthenticationPrincipal Jwt jwt) {
    return cache.get(id)                                      // p99 target: < 200 ms
        .filter(v -> v.customerId().equals(jwt.getSubject()))  // security requirement
        .orElseGet(() -> trackingStore.load(id, jwt.getSubject())
                                      .map(cache::putAndReturn)
                                      .orElseThrow(NotFoundException::new));
}flowchart LR
C[Clients] --> CDN --> GW[API gateway] --> T[Tracking service]
T --> R[(Redis cache)]
T --> D[(DynamoDB)]
K[[Kafka: carrier events]] --> T# ADR-012: Serve tracking reads from cache with 5 s freshness
Status: Accepted
Context: 25k peak read QPS, p99 < 200 ms, product accepts ≤ 5 s staleness.
Decision: Redis cache-aside, TTL 30 s, event-driven invalidation on status change.
Alternatives: direct DB reads (cost, latency), CDN caching (per-user data).
Consequences: eventual consistency window; cache capacity to manage.6Practical Examples
6.1 Order tracking first cut
The initial ShopNow design had clients call the order service directly. Applying the process — clarify, estimate, design — revealed a 30:1 read/write ratio and a 30× sale peak, justifying a dedicated tracking read model with cache.
6.2 Avoiding over-design
An early proposal included a service mesh, three databases and a graph store. Tracing each box to a driver removed four components with no requirement behind them.
6.3 Interview vs production
In a 45-minute interview the same process runs in compressed form: 5 minutes clarifying, 5 estimating, 15 high-level, 15 deep dive, 5 trade-offs.
6.4 Worked example — responsibilities
Scenario. ShopNow's order-tracking feature was slowing down the order service, because every "where is my order?" request read from the same tables that processed orders.
| Component | Responsibility |
|---|---|
| Tracking service | Read model for order status |
| Order service | System of record for orders |
What it shows. Giving each component one clear responsibility solved the problem. The order service remains the system of record: it creates and updates orders and owns their truth. The tracking service maintains a separate read model, optimised for answering status queries quickly, and is updated from order and carrier events. Tracking traffic, which is about twenty times higher than order writes, no longer competes with order processing. Each service can now scale and change independently, and the responsibilities are easy to explain to new team members.
Common mistake. Letting one component do everything because it already has the data, which couples very different workloads.
Takeaway. Give each component a single, clear responsibility, and separate systems of record from read models.
6.5 Worked example — sync vs async
Scenario. ShopNow had to decide how customers and carriers should interact with the tracking system.
| Interaction | Choice |
|---|---|
| Customer reads status | Sync HTTP |
| Carrier updates | Async events |
What it shows. Interface style follows the need. Customers reading their order status expect an immediate answer, so a synchronous HTTP call is the right choice. Carrier updates arrive in bursts from many partners and do not need an instant reply, so they are received as asynchronous events through Kafka. This lets the system absorb spikes from carriers without slowing customer reads, and a temporary problem in tracking updates does not block carriers from sending data.
Common mistake. Using the same interface style everywhere, for example making every call synchronous, which spreads failures and bottlenecks.
Takeaway. Choose synchronous or asynchronous interfaces based on each interaction's latency and coupling needs.
6.6 Worked example — failure walkthrough
Scenario. Before launch, ShopNow's architects walked through what tracking should do when each dependency fails.
| Failure | Behaviour |
|---|---|
| Cache down | Reads fall back to DB with rate limits |
| DB slow | Serve stale cache, degrade ETA |
What it shows. The walkthrough defines behaviour for each failure. If the Redis cache is down, reads fall back to the database, with rate limits so the database is not overwhelmed. If the database is slow, the service serves slightly stale data from cache and shows a less precise delivery estimate rather than an error. These decisions were made calmly during design rather than during an incident, and both were tested in staging with fault injection before go-live.
Common mistake. Designing only the happy path and discovering failure behaviour in production.
Takeaway. Walk through each dependency failure during design, and decide how the system should degrade.
6.7 Worked example — interview whiteboard
Scenario. In interviews, ShopNow asks: "What is system design, and how do you approach it?"
| Prompt | Answer outline |
|---|---|
| "What is system design and how do you approach it?" | "Defining components, interfaces, data and deployment to meet functional requirements and quality attributes within constraints. Process: clarify FR/NFRs, constraints, assumptions; estimate traffic/storage; high-level design with building blocks; deep-dive critical parts; evaluate trade-offs, failures and cost; document with diagrams, ADRs, API specs; iterate." |
Why it works. The outline defines system design as choosing components, interfaces, data and deployment to meet functional and non-functional requirements within constraints. It then gives a process: clarify requirements and scope, estimate scale with numbers, sketch a high-level design from standard building blocks, deep-dive into the riskiest parts, discuss trade-offs and failure modes, and iterate. Interviewers hear both a clear definition and a repeatable approach.
Common mistake. Starting to draw boxes before asking about users, scale or requirements.
Takeaway. Define system design clearly, then show a disciplined process from requirements to trade-offs.
6.8 Worked example — NovaBank contrast
Scenario. NovaBank's architects were asked why the UPI switch and the order-tracking style services looked so different.
| System | Dominant driver |
|---|---|
| UPI switch | Availability + integrity |
| Tracking | Read latency + cost |
What it shows. Different dominant drivers produce different designs. The UPI switch is driven by availability and integrity: payments must not be lost or duplicated, so it uses active-active regions, strong consistency and idempotency everywhere. A tracking service is driven by read latency and cost: slightly stale data is acceptable, so it uses caches, read replicas and eventual consistency. Copying either design to the other system would either overspend or under-protect.
Common mistake. Using one standard architecture for every system regardless of its drivers.
Takeaway. Let each system's dominant drivers shape its design.
6.9 Worked example — anti-patterns
Scenario. ShopNow's architecture reviews kept finding the same design problems across teams.
| Anti-pattern | Effect |
|---|---|
| Jumping to technology | Solutions without problems |
| Resume-driven design | Complexity |
| No numbers | Unsized systems |
| Ignoring operations | Unrunnable designs |
What it shows. The table names the anti-patterns. Jumping to technology produces solutions without a clear problem. Résumé-driven design adds fashionable tools that create complexity without benefit. Designing without numbers leaves systems unsized, so they either fail under load or waste money. Ignoring failure modes leaves the system fragile. ShopNow now requires requirements, estimates and failure analysis before any technology discussion in design reviews.
Common mistake. Choosing technology first and then searching for requirements that justify it.
Takeaway. Start from requirements and numbers, and justify every technology choice against them.
6.10 Worked example — C4 container view
Scenario. ShopNow needed to explain the tracking design to developers, operations and security reviewers.
| Container | Tech |
|---|---|
| Tracking API | Spring Boot 4 on EKS |
| Status store | DynamoDB |
What it shows. The C4 container view shows the right level of detail for that audience: the deployable units and their technology. The tracking API runs as Spring Boot 4 on EKS, and the status store is DynamoDB, chosen for predictable low-latency reads at scale. Arrows show how they communicate. Reviewers can understand the system's shape without reading code, and the diagram lives in the repository so it is updated alongside the system.
Common mistake. Putting every class and configuration detail on one diagram, which makes it unreadable.
Takeaway. Use the right C4 level for the audience, and keep diagrams versioned with the code.
6.11 Worked example — sequence diagram use
Scenario. The team needed to confirm that carrier updates were applied in the right order and that the cache never served outdated status for long.
| Flow | Why diagram |
|---|---|
| Carrier webhook → Kafka → tracking update → cache invalidate | Timing and ordering |
What it shows. A sequence diagram shows the dynamic flow: a carrier webhook arrives, is published to Kafka, the tracking service updates the status store and then invalidates the cache. Drawing it exposed a timing problem: if the cache was invalidated before the store update completed, a read could reload old data. The order was fixed, and the diagram became part of the design documentation for future changes.
Common mistake. Relying only on static diagrams, which cannot show timing and ordering problems.
Takeaway. Use sequence diagrams for flows where timing and ordering matter.
6.12 Worked example — cost estimate
Scenario. ShopNow's finance team asked how much the tracking system would cost each month before approving it.
| Component | Monthly |
|---|---|
| EKS pods | ₹6 L |
| DynamoDB | ₹3 L |
| Redis | ₹2 L |
What it shows. A cost estimate treats cost as a quality attribute. EKS pods were estimated at ₹6 lakh a month, DynamoDB at ₹3 lakh and Redis at ₹2 lakh, about ₹11 lakh in total. The estimate showed that caching reduced DynamoDB reads enough to pay for Redis. Finance approved the design, and actual costs after launch were within 8% of the estimate.
Common mistake. Leaving cost until after launch, when design changes are expensive.
Takeaway. Estimate cost during design and use it to compare options.
6.13 Worked example — evolvability
Scenario. ShopNow expected to add new delivery carriers regularly, each with its own data formats.
| Future need | Design hook |
|---|---|
| New carriers | Adapter per carrier |
What it shows. The design includes a hook for change: an adapter per carrier that translates its format into ShopNow's standard tracking events. Adding a new carrier means writing and deploying one adapter, without touching the core tracking service. Over the following year, five carriers were added this way, each in under two weeks. Each adapter is tested against the carrier's sample data, so a faulty adapter is caught before it can send bad events into the core system.
Common mistake. Building carrier-specific logic into the core service, so each new carrier requires risky changes.
Takeaway. Design explicit extension points for changes you can predict.
6.14 Worked example — bottleneck
Scenario. During flash sales, thousands of customers checked the same popular orders at the same moment.
| Location | Mitigation |
|---|---|
| Hot orders during flash sale | Request coalescing |
What it shows. The deep dive identified a bottleneck: hot keys for these orders caused many identical requests to hit the store at once when the cache expired. Request coalescing lets one request fetch the value while others wait for the result, so the store sees one read instead of thousands. Load tests showed database reads during the sale peak falling by more than 90%.
Common mistake. Designing for average load and missing hot spots that appear during peaks.
Takeaway. Deep-dive into likely bottlenecks, especially hot keys and peak events.
6.15 Worked example — security in design
Scenario. A requirement stated that customers must only ever see their own orders.
| Requirement | Design element |
|---|---|
| Customers see own orders | Ownership check + tokens |
What it shows. Security is part of the design, not an add-on. The tracking API verifies the customer's token and checks that the order belongs to that customer before returning anything, as described in Volume I. Tracking links sent by email use signed, time-limited tokens rather than guessable order numbers. Penetration tests found no way to view another customer's order. These checks are covered by automated tests, so a later change cannot quietly remove them without failing the build.
Common mistake. Treating security as a separate review after design is finished.
Takeaway. Build security requirements into components and interfaces from the start.
6.16 Worked example — interview follow-ups
Scenario. Interviewers at ShopNow ask follow-up questions after the main system design answer.
| Follow-up | Answer |
|---|---|
| "System design vs architecture?" | Overlapping; system design focuses on one system's structure at scale |
| "How much detail?" | Enough to justify decisions and expose risks |
Why it works. System design and architecture overlap, but system design usually focuses on the structure of one system at scale, while architecture also covers wider concerns across systems and the organisation. On detail, the answer is enough to justify key decisions and show risks: high-level design first, then deep dives where the risk is highest. Candidates who adjust depth to the question show judgement.
Common mistake. Giving the same level of detail for every component.
Takeaway. Explain how system design relates to architecture, and adjust depth to risk.
6.17 Worked example — checklist
Scenario. ShopNow reviews each design against a system design checklist before implementation starts.
| Item | ✔ |
|---|---|
| Requirements clarified | ✔ |
| Numbers estimated | ✔ |
| Building blocks justified | ✔ |
| Deep dives done | ✔ |
| Trade-offs documented | ✔ |
| Failures considered | ✔ |
What it shows. The checklist confirms that requirements are clarified, numbers are estimated, building blocks are justified, deep dives are completed for risky parts and trade-offs are documented. Designs that skip an item return for more work. Since its introduction, fewer designs needed major changes after implementation began. Teams also use the checklist themselves before the review, so most gaps are fixed before anyone else looks at the design.
Common mistake. Using the checklist only for large projects, while small designs skip basic steps.
Takeaway. Apply a light design checklist to every significant change.
6.18 Worked example — iteration
Scenario. Load testing the tracking system before a big sale showed slow responses in the first minutes after a deployment.
| Iteration | Change |
|---|---|
| After load test | Added cache warming before sales |
What it shows. Design evolves with evidence. The test showed that caches started empty after deployment, so the first wave of requests hit the database. The team added cache warming before sales, loading popular orders in advance. The next test met the latency target from the first minute. The ADR was updated to record the change.
Common mistake. Treating the first design as final instead of improving it with test results.
Takeaway. Iterate the design based on tests and real measurements.
6.19 Worked example — deployment view
Scenario. The team needed to decide where the tracking system would run.
| Aspect | Choice |
|---|---|
| Regions | ap-south-1 (multi-AZ) |
What it shows. The deployment view records the choice: ap-south-1, the Mumbai region, across multiple availability zones. That meets latency needs for Indian customers and survives the loss of one zone. Multi-region was considered but not chosen, because tracking can tolerate short outages better than payments, and the extra cost was not justified. The decision can be revisited if requirements change. The deployment view also records the instance types, scaling limits and network layout, so operations teams know exactly what they are running.
Common mistake. Choosing multi-region by default without checking whether requirements justify the cost.
Takeaway. Make deployment decisions explicit and tie them to availability needs.
6.20 Worked example — review checklist
Scenario. ShopNow's design reviews often debated components without knowing why they existed.
| Question | Why |
|---|---|
| Which NFR drives this component? | Traceability |
What it shows. The review checklist now asks for each component: which non-functional requirement drives it? A cache must point to a latency or cost target; a queue must point to a reliability or decoupling need. Components without a driver are questioned and often removed. Reviews became shorter and designs simpler. The same question is asked again when components are added later, so the design stays lean as it grows.
Common mistake. Accepting components because they are common in other systems.
Takeaway. Trace every component to a requirement during reviews.
6.21 Worked example — interview scenario
Scenario. In an interview, a candidate is asked to "Design Twitter in 45 minutes".
| Question | Answer |
|---|---|
| "Design Twitter in 45 minutes" | Clarify scope first; don't design everything |
Why it works. A strong answer starts by clarifying scope: which features matter, such as posting and the home timeline, and what scale to assume. It explicitly leaves out features such as advertising and direct messages. The candidate then designs the agreed scope well, with estimates, building blocks and a deep dive into timeline generation. Trying to design everything leads to a shallow answer.
Common mistake. Trying to cover every feature, leaving no time for depth.
Takeaway. Control scope early, then design the chosen parts well.
6.22 Worked example — decisions log
Scenario. Months after launch, new engineers asked why the tracking system used its particular cache strategy and event ordering.
| ADR | Topic |
|---|---|
| ADR-012 | Cache strategy |
| ADR-013 | Event ordering |
What it shows. The decisions log answers that. ADR-012 records the cache strategy, including the TTL and invalidation choice. ADR-013 records how event ordering is guaranteed by partitioning on the order ID. Each ADR lists the alternatives and why they were rejected. New engineers can understand and safely change the design without repeating old debates.
Common mistake. Relying on the memory of the original team, which is lost as people move on.
Takeaway. Keep a decision trail so the reasoning survives team changes.
6.23 Worked example — observability in design
Scenario. ShopNow wanted to know whether the tracking system was meeting its design targets in production.
| Signal | Purpose |
|---|---|
| p99 latency, cache hit ratio | Verify NFRs |
What it shows. Observability was designed in from the start. The p99 latency metric verifies the response-time requirement, and the cache hit ratio verifies the assumption that most reads are served from cache. Dashboards and alerts are tied to these targets. When the hit ratio dropped after a change, the team found and fixed a cache key bug within a day. Because targets and metrics were defined together, the team could prove to stakeholders that the system met its requirements.
Common mistake. Adding monitoring after launch without linking it to design targets.
Takeaway. Design observability so every key requirement can be measured.
6.24 Worked example — data ownership
Scenario. Two ShopNow teams both changed order data, and conflicting updates caused errors.
| Data | Owner |
|---|---|
| Order | Order service |
| Tracking view | Tracking service (derived) |
What it shows. Clear data ownership removes the conflict. The order service owns the order and is the only one that changes it. The tracking service owns only its derived tracking view, built from events. Other services request changes through the owner's API or events. After ownership was clarified, the conflicting updates stopped. Ownership is recorded in the service catalogue, so new teams know whom to ask before using or changing any data.
Common mistake. Allowing several services to write the same data.
Takeaway. Give each piece of data one owner, and derive other views from it.
6.25 Worked example — simplicity principle
Scenario. A ShopNow team proposed splitting tracking into three microservices from day one.
| Option | Choice |
|---|---|
| One service vs three micro | One until scaling/ownership demands split |
What it shows. The simplicity principle chose one service until scale or team ownership demands a split. One service was easier to build, test and operate, and its internal modules were kept separate so a later split would be straightforward. A year later, it still met all its requirements as one service. When a separate team later took over carrier integrations, that module was split out cleanly in a few weeks.
Common mistake. Splitting early for theoretical future needs, adding network calls and operational work without benefit.
Takeaway. Start simple, keep clear internal boundaries and split only when there is a real need.
6.26 Worked example — stakeholders
Scenario. ShopNow's tracking design needed approval from product, SRE and finance.
| Stakeholder | Interest |
|---|---|
| Product | Features, UX |
| SRE | Operability |
| Finance | Cost |
What it shows. Each stakeholder has a different interest. Product cares about features and user experience, SRE cares about operability, and finance cares about cost. The design document included a section for each: user journeys for product, runbooks and SLOs for SRE, and the cost estimate for finance. Approval took one meeting instead of several. Each stakeholder also knew which section to check when the design changed later.
Common mistake. Presenting one technical view that leaves stakeholders searching for what matters to them.
Takeaway. Present the design in ways that answer each stakeholder's concerns.
7Common Problems & Mistakes
| Mistake | Fix |
|---|---|
| Technology first | Requirements first |
| No numbers | Estimate |
| Hidden trade-offs | ADRs |
| No failure thinking | Walkthroughs |
8Performance & Production Considerations
| Consideration | Practice |
|---|---|
| Validate with load tests | Before launch |
| Observe NFRs | Dashboards |
| Revisit design | After incidents |
9Architecture & Design Considerations
| Guideline | Detail |
|---|---|
| Trace boxes to drivers | Justification |
| Right abstraction level | Audience |
| Explicit trade-offs | Documented |
10Interview Questions & Answers
What is system design?
System design is the process of defining a system's components, interfaces, data and deployment so that it meets its functional and non-functional requirements within constraints such as budget, deadlines and team skills. It decides what the building blocks are, how they communicate, where data lives and who owns it, and how the system behaves under load and failure. The result is a design that can be built, tested, operated and changed, with the reasons for each important choice recorded. Good system design is iterative and evidence-driven.
Name standard building blocks.
Common building blocks include a CDN to serve static and cacheable content close to users; load balancers to spread traffic; stateless application services; caches such as Redis for fast reads; databases, relational or NoSQL, for durable data; message queues or event streams such as Kafka for asynchronous work; object storage such as S3 for files; and search engines such as OpenSearch. Most designs combine these blocks, chosen according to the system's requirements. Knowing each block's strengths, limits and failure modes is what allows a designer to combine them well and justify every choice.
What are the steps of the design process?
A typical process has six steps. Clarify requirements and scope, including functional needs and quality targets. Estimate scale with numbers such as requests per second and data volume. Draw a high-level design from standard building blocks. Deep-dive into the riskiest parts, such as hot spots or consistency. Discuss trade-offs and failure modes. Iterate as new information appears. Following these steps keeps designs grounded in requirements rather than favourite technologies. The same steps apply in interviews and real projects, although real projects spend much longer on clarification, validation and iteration with stakeholders.
What is the C4 model?
The C4 model describes software architecture at four levels of detail. The context diagram shows the system, its users and external systems. The container diagram shows deployable units, such as services, databases and queues, with their technologies. The component diagram shows the main parts inside one container. The code level shows classes and is rarely drawn by hand. Choosing the right level for each audience makes diagrams clear and useful. Supplementary views, such as deployment and sequence diagrams, show where the system runs and how key flows behave over time.
Give a common trade-off.
A common trade-off is latency versus consistency when using caching. A cache makes reads much faster and reduces database load, but cached data can be slightly out of date. A short TTL or event-driven invalidation improves freshness but increases load and complexity. The right balance depends on the requirement: product listings can tolerate a few seconds of staleness, while account balances usually cannot. Good designs state the trade-off explicitly. Other common trade-offs include cost versus availability, simplicity versus flexibility, and throughput versus latency, and each should be decided with numbers wherever possible.
How do you document decisions?
Document significant decisions as Architecture Decision Records, or ADRs. Each ADR states the context and drivers, the decision, the alternatives considered and the consequences, both positive and negative. ADRs are short, numbered and stored with the code or in a shared repository. When a decision changes, a new ADR supersedes the old one rather than editing it, so the history remains. This preserves reasoning as teams change. Linking ADRs to the drivers they address, and to tests or fitness functions that verify them, makes decisions easy to justify and check.
How do you evaluate a design?
Evaluate a design by testing it against requirements before building it. Walk through key scenarios, such as peak traffic or a new feature, to check the design handles them. Analyse failure modes, asking what happens when each dependency fails. Look for bottlenecks and hot spots. Estimate cost. Review security and operability. Where risk is high, build prototypes or run load tests. Then confirm the design in production with metrics tied to its targets. Reviews with experienced peers often find risks the original team has missed.
How do you avoid over-design?
Avoid over-design by tracing every component to a driver, such as a latency target, scale estimate or reliability requirement. If a component cannot be justified, remove it. Start with the simplest design that meets current requirements, keep clear internal boundaries so the design can grow, and add complexity only when evidence such as load tests or real growth shows it is needed. Reviews should ask "what requirement needs this?" for each part. Simplicity also makes systems cheaper to run and easier to change.
System design vs solution architecture?
System design usually focuses on the structure of one system: its components, data, scaling and failure handling. Solution architecture covers the end-to-end business solution, which may span several systems, integrations, vendors, processes and organisational changes. It starts from business goals and constraints, decides which systems are built, bought or changed, and then relies on system design for each part. Solution architects need both perspectives. In practice, the roles overlap: a solution architect must understand system design deeply, and a system designer must understand the business outcomes the system supports.
What makes a design good?
A good design meets measurable requirements, and every important decision is justified by those requirements. It handles expected load and failures gracefully, is as simple as possible, has clear ownership of components and data, and can be operated, observed and secured. It is also evolvable, with clear boundaries and extension points, so it can change as needs change. Its decisions are recorded, so others can understand and improve it. In short, a good design is fit for purpose today and ready for change tomorrow, without unnecessary complexity.