 Architect

- Prerequisites
- 1.1 Interpretation
- Covers
- Purpose · Runtime compilation · Native code · Hot methods
- Related
- 1.3 HotSpot · 1.4 Tiered Compilation · Chapter 2 · Chapter 3
On this page
1Concept / Definition
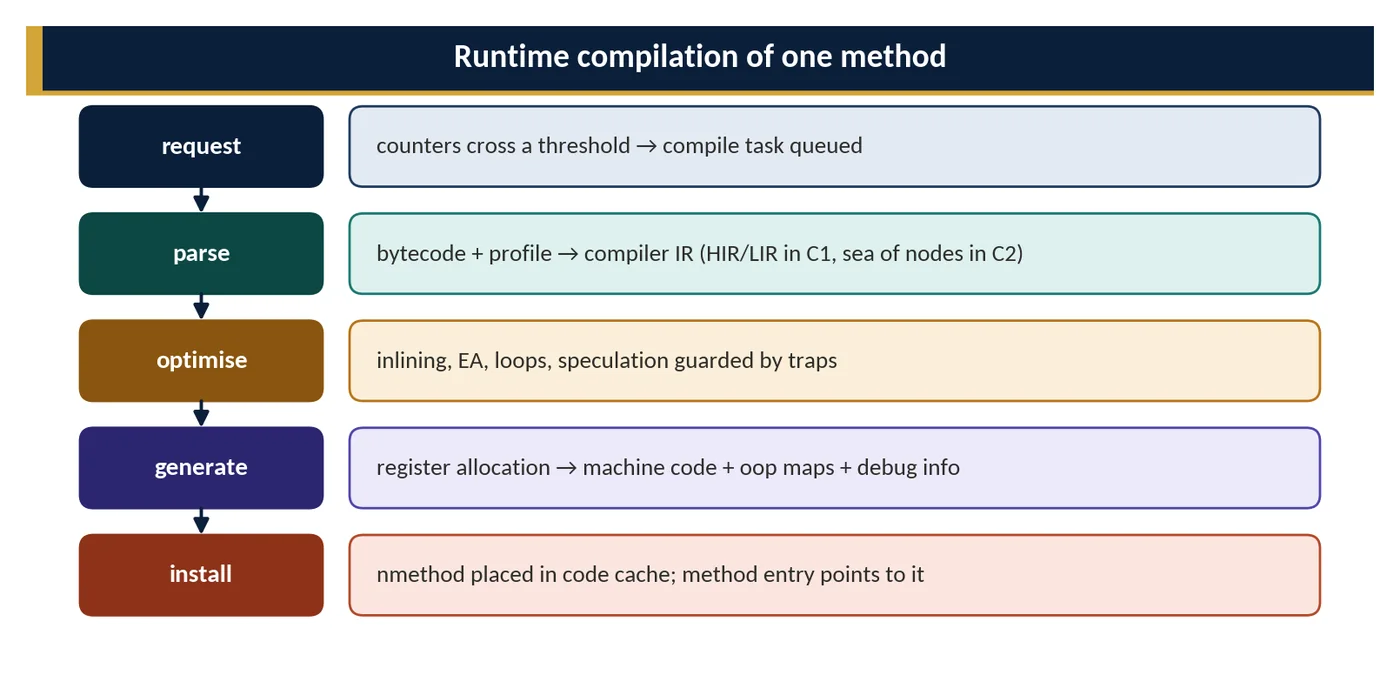
A just-in-time (JIT) compiler translates bytecode into native machine code while the program runs, for the methods that are executed often (hot methods). The compiled code is stored in the code cache and used for subsequent calls. Because compilation happens at run time, the JIT can optimise for the actual workload — the observed call targets, branch frequencies and loaded classes — and speculate on assumptions that a static compiler could never make.
2Why It Exists
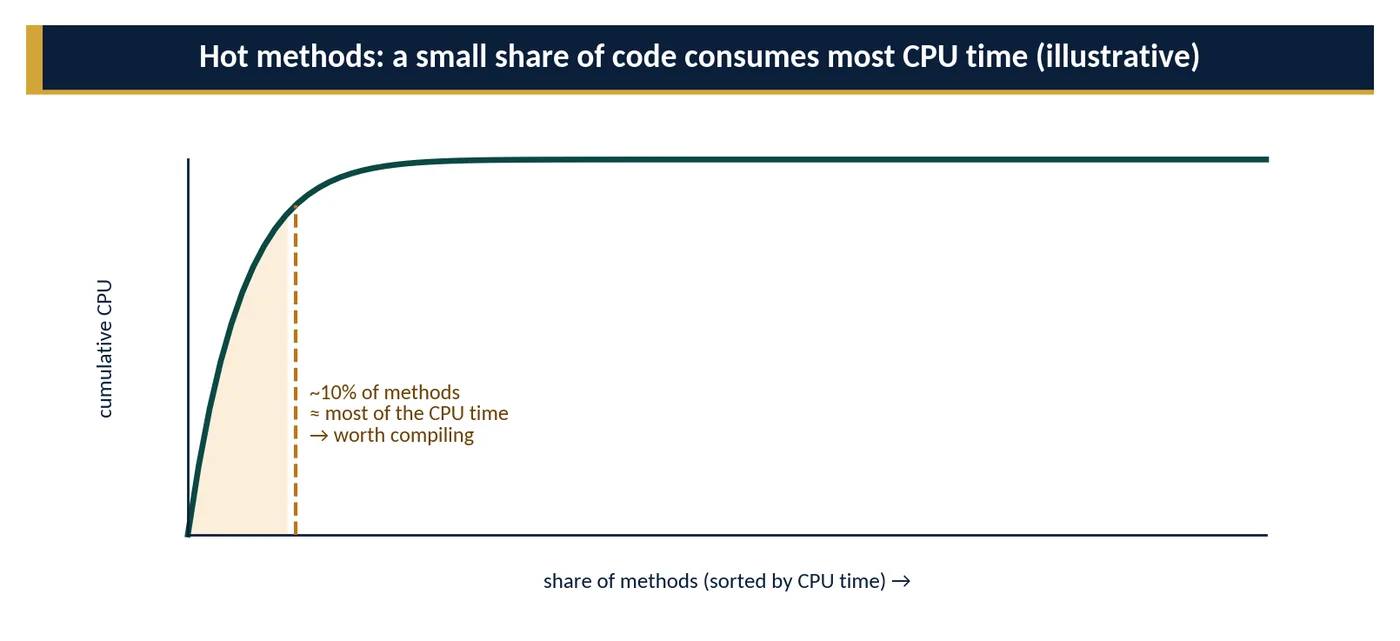
Interpretation is flexible but slow; static (ahead-of-time) compilation is fast but blind to run-time behaviour and to classes loaded dynamically. A JIT combines both: start immediately, then invest compilation effort only where it pays off, using information unavailable before execution. For long-running Java services this yields peak performance comparable to, and in some cases better than, statically compiled code.

3Core Concepts
Purpose
| Goal | How the JIT achieves it |
|---|---|
| Speed of hot code | native code, register allocation, inlining, loop optimisation, vectorisation |
| Adapt to real workload | profile-guided decisions: inline the observed receiver, lay out likely branches |
| Remove abstraction cost | devirtualisation, escape analysis, intrinsics (Chapter 2) |
| Handle dynamic class loading | speculate on the current class hierarchy; deoptimise when it changes (Chapter 3) |
| Keep startup fast | compile only hot methods, in the background |
Runtime compilation
In the background
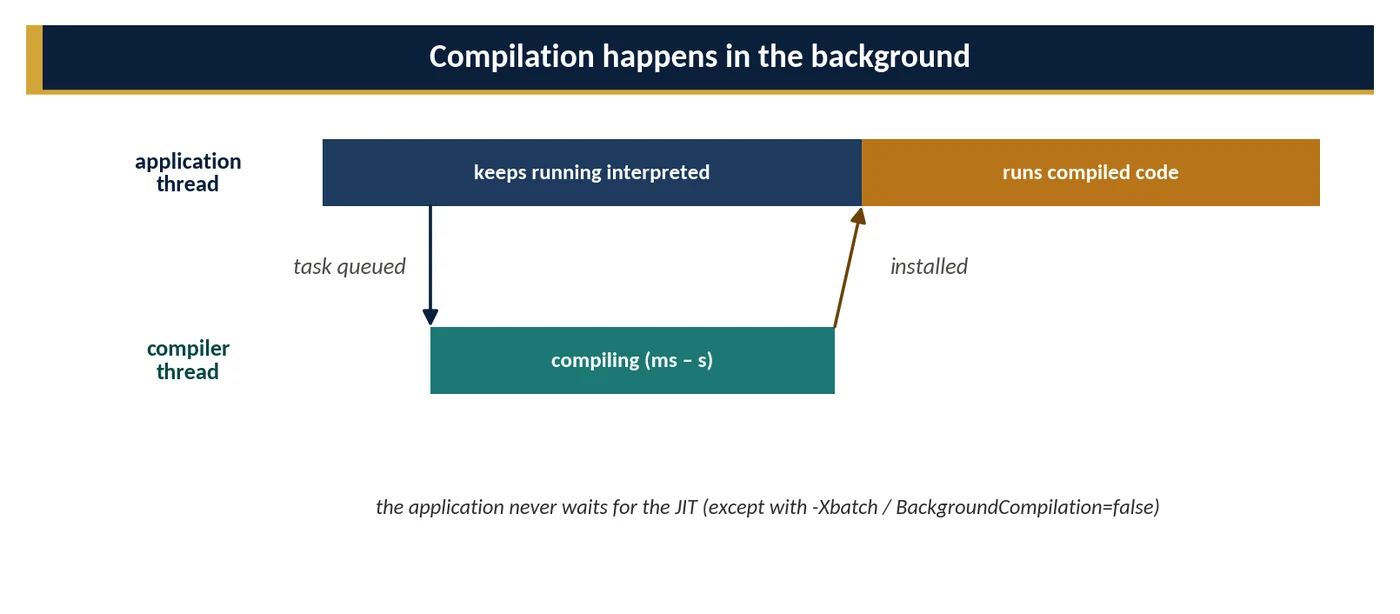
Compile requests are queued and processed by dedicated compiler threads; the application thread continues in the interpreter (or older compiled code) and switches to the new code on its next call — or immediately via OSR for running loops. Compilation therefore consumes CPU but does not block application threads (unless -Xbatch / -XX:-BackgroundCompilation is set).
Costs
- CPU for compiler threads — highest during warm-up and after deployments.
- Memory — compiler arenas during compilation (visible in NMT as 'Compiler'), code cache for results.
- Time to peak — minutes of mixed interpreted/C1/C2 execution before steady state.
- Bailouts — a compilation can fail (too large, unsupported construct); the method stays at a lower tier.
Native code
What gets produced
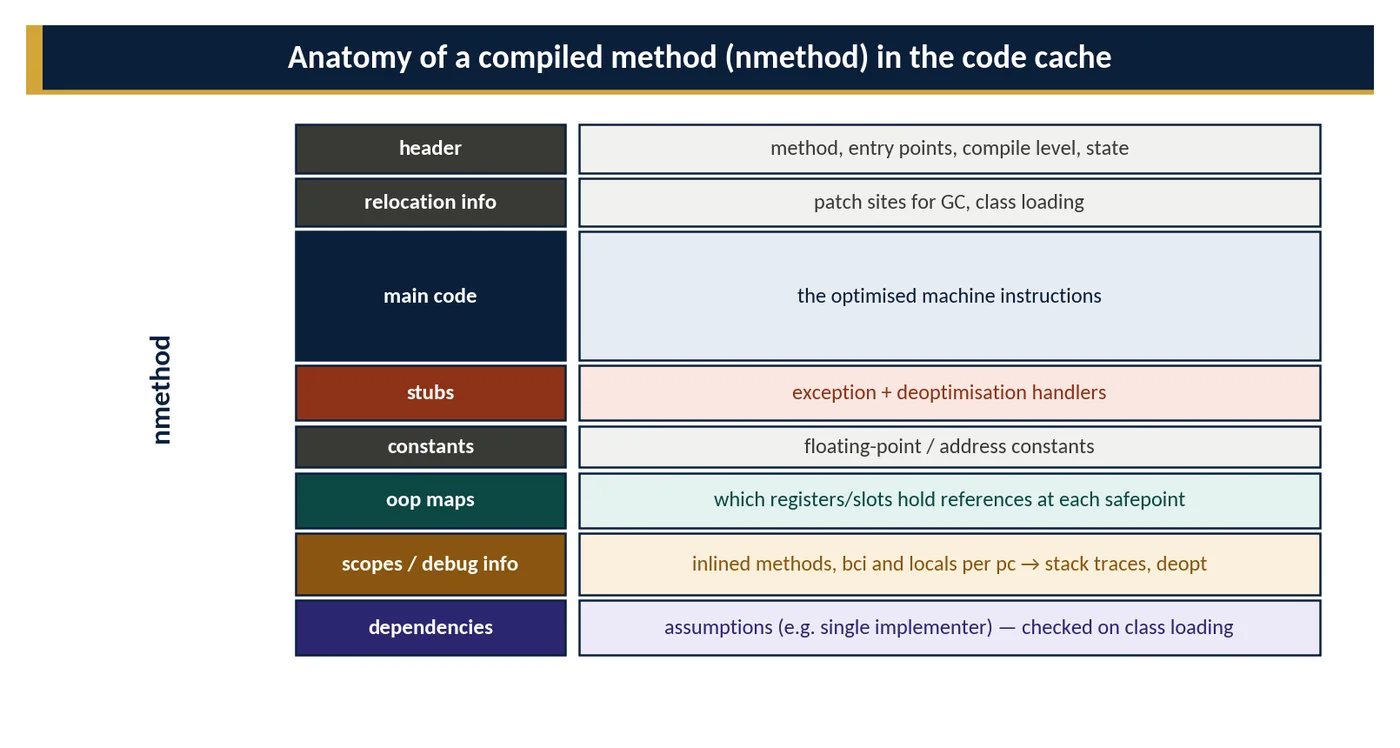
A compilation produces an nmethod: the machine code plus the metadata the VM needs to run it safely alongside GC, class loading, deoptimisation and debugging.
Lifecycle of compiled code
| State | Meaning |
|---|---|
| in use | entry points route calls to it |
| not entrant | replaced (new tier) or invalidated; new calls go elsewhere, active frames may still run in it |
| unloaded / freed | no longer referenced; memory returned to the code cache (by GC-driven unloading since the code-cache sweeper was removed in JDK 20) |
The code cache
A segmented native memory area (default reservation 240 MB with tiered compilation) holding interpreter templates, stubs, profiled C1 code and non-profiled C1/C2 code. If it fills up, the JIT stops compiling ('CodeCache is full. Compiler has been disabled') and new hot code stays interpreted — a silent performance cliff.
Hot methods
Why target hot code
How 'hot' is decided
HotSpot counts invocations and loop back-edges per method and compares them with thresholds (1.3). A method called thousands of times, or containing a loop that iterates tens of thousands of times, becomes a compilation candidate. Thresholds are scaled with compile-queue length so a busy JIT is not flooded.
What is never or rarely compiled
- Methods executed only a few times (most code).
- Huge methods: bytecode larger than 8000 bytes is not compiled by default (
DontCompileHugeMethods) — one reason to avoid giant generated methods. - Methods excluded by compiler commands or whose compilation repeatedly fails ('COMPILE SKIPPED').
- Native methods get small generated wrappers rather than compiled bodies.
4How It Works Internally
Compile requests become CompileTasks in per-compiler queues managed by the CompileBroker. A compiler thread builds the compiler's intermediate representation from bytecode and profiles, optimises it, allocates registers, emits code and metadata, and installs the nmethod — atomically updating the method's entry points. Before installation, the recorded dependencies (assumptions about loaded classes) are validated; if class loading invalidated one during compilation, the result is discarded. Compiled code calls other compiled code directly or through inline caches and calls back into the VM for slow paths (allocation, class initialisation, uncommon traps).
5APIs / Features / Syntax
$ java -XX:+PrintCompilation -jar app.jar | head -8
     52    1       3       java.lang.String::hashCode (60 bytes)
     55    4       3       java.lang.StringLatin1::hashCode (42 bytes)
     61    7     n 0       java.lang.invoke.MethodHandle::linkToStatic(LL)L (native)   (static)
     95   23       4       java.lang.String::hashCode (60 bytes)
     96    1       3       java.lang.String::hashCode (60 bytes)   made not entrant
#  time(ms) id  attrs tier  method (bytecode size)

$ jcmd <pid> Compiler.codecache
CodeHeap 'non-profiled nmethods': size=119168Kb used=21540Kb max_used=21540Kb free=97628Kb
CodeHeap 'profiled nmethods': size=119164Kb used=38212Kb max_used=41880Kb free=80952Kb
CodeHeap 'non-nmethods': size=7428Kb used=1992Kb ...
total_blobs=13245 nmethods=11876 adapters=812 ... compilation: enabled# Control compilation of specific methods (diagnostics only)
$ java -XX:CompileCommand=exclude,com.acme.Suspicious::method -jar app.jar
# needs hsdis for assembly
$ java -XX:CompileCommand=print,com.acme.Pricing::total -jar app.jar
# Compiler directives at run time (JEP 165)
$ jcmd <pid> Compiler.directives_add directives.json
$ jcmd <pid> Compiler.directives_print6Practical Examples
| Symptom | JIT explanation | Action |
|---|---|---|
| CPU spike for 1–3 min after each deploy | compiler threads busy during warm-up | CPU headroom at start, AOT cache, gradual rollout |
| Throughput drops after hours; log shows CodeCache is full | JIT disabled | raise ReservedCodeCacheSize; find class/code churn |
| One method never gets fast | too large (>8000 bytes) or compilation fails | split method; check PrintCompilation for 'COMPILE SKIPPED' |
| Performance changes after library upgrade | different inlining/profiles | compare JFR hot methods and compilation events |
7Common Problems & Mistakes
- Believing the JIT compiles everything eventually — only hot code is compiled.
- Generating giant methods (templating, code generators) that exceed the huge-method limit.
- Using
-Xcompor disabling background compilation in production. - Ignoring code-cache metrics in services with dynamic class generation.
8Performance & Production Considerations
- Monitor code-cache usage (
jvm_memory_used_bytes{area="nonheap",id=~"CodeHeap.*"}) and compiler time (CompilationMXBean.getTotalCompilationTime). - Account for compiler threads in CPU sizing; small containers spend a larger share of CPU on compilation during warm-up.
- JFR
jdk.Compilationevents (with thresholds) reveal slow or failing compilations.
9Architecture & Design Considerations
JIT compilation shapes how Java services behave over their lifetime: slower at first, then fast and stable. Architectures that restart or scale instances frequently pay warm-up repeatedly; those that keep instances long-lived benefit most. The JIT also rewards code with stable, predictable behaviour — monomorphic call sites, consistent types, small hot methods — which aligns well with clean, cohesive design.
10Interview Questions & Answers
What is a JIT compiler?
A JIT compiler translates bytecode into native machine code while the program runs, but only for methods that execute often, the hot methods. Everything starts in the interpreter, which counts invocations and loop iterations and collects profiles. When a method crosses its threshold, a compiler thread compiles it in the background and installs the result as an nmethod in the code cache, and later calls jump straight to it. Because it compiles at run time, the JIT can optimise for the actual workload: the receiver types it has seen, the branches actually taken and the classes currently loaded. In HotSpot, C1 provides quick compilation and C2 provides heavy optimisation.
What advantages does JIT compilation have over ahead-of-time compilation?
The JIT knows things an ahead-of-time compiler cannot. It sees real profiles, so it can inline the one implementation actually used at an interface call site, order branches by observed frequency and drop paths that never run. It sees the classes actually loaded, including ones generated at run time by proxies and frameworks, and can speculate on the current class hierarchy, deoptimising safely if a new class breaks an assumption. It can also target the exact instruction set of the CPU it runs on. The price is warm-up time, compiler CPU and code-cache memory. AOT, such as GraalVM Native Image, wins on startup and footprint, while the JIT usually wins on long-running peak throughput.
Does the application wait while the JIT compiles a method?
No. Compilation is asynchronous: the request is queued as a CompileTask and processed by dedicated compiler threads, while the application thread carries on in the interpreter or in older, lower-tier compiled code. When compilation finishes, the method's entry point is switched atomically and the next call uses the new code. A long-running loop does not have to wait for the next call either, because on-stack replacement moves the running frame into compiled code at a loop back-edge. The application does pay indirectly, since compiler threads use CPU that request threads compete for. Only -Xbatch or -XX:-BackgroundCompilation make threads wait, which is useful for tests, not for production.
What is stored with compiled code besides instructions?
An nmethod contains much more than machine code, because the VM must manage it safely. It has relocation information for addresses embedded in the code, and stubs for exception handling and deoptimisation. It has oop maps that tell the GC which registers and stack slots hold object references at each safepoint. Debug information describes the inlined scopes and how to rebuild interpreter frames, which makes accurate stack traces and deoptimisation possible. It also records dependencies, the class-hierarchy assumptions it was compiled under, so loading a new class invalidates exactly the affected code. Finally, there is metadata such as the compile tier, entry points and the method the code belongs to.
What happens when the code cache is full?
Compilation stops, but the application keeps running. HotSpot prints 'CodeCache is full. Compiler has been disabled', existing compiled methods stay in use, and every method that becomes hot afterwards remains interpreted, so throughput drops and CPU rises gradually. There is no exception, which is why it is easy to miss. With tiered compilation the code cache is segmented into non-method, profiled and non-profiled heaps, with 240 MB reserved by default, and since the sweeper was removed in JDK 20 unused code is freed through GC-driven unloading. The fix is to raise ReservedCodeCacheSize, find the churn behind it, such as generated classes or repeated redeploys, and alert on CodeHeap metrics.
Why might a hot method never be compiled?
Usually because it is too big. Methods whose bytecode exceeds 8000 bytes are skipped by default because of DontCompileHugeMethods, which is common with code generated from templates, parsers or giant switch statements. Second, its compilation may keep failing or bailing out, for example on an unsupported construct or an oversized graph, leaving it at a lower tier; PrintCompilation shows 'COMPILE SKIPPED' with a reason. Third, it may be excluded by a CompileCommand or directive that someone forgot to remove. Also check that the method is genuinely hot and not just showing time spent in its callees. Use JFR compilation and compilation-failure events, then split the method rather than disabling the limit.
How does JIT behaviour influence deployment strategy?
JIT warm-up means each new instance starts slow and CPU-hungry, so deployment must treat warm-up as a phase. Rollouts should shift traffic gradually, through canaries or load-balancer slow start, rather than switching everything at once. Readiness probes should pass after warm-up, optionally after synthetic warm-up requests. Autoscaling should trigger earlier, because new capacity takes minutes to reach peak throughput, and containers need CPU headroom at startup for the compiler threads. Workloads that restart often or scale to zero pay warm-up repeatedly, which pushes towards the Java 25 AOT cache with recorded profiles, CRaC checkpoints or GraalVM Native Image, trading some peak performance for fast start.