 Architect

- Prerequisites
- B2V1 4.4 JVM Instructions · B2V1 4.5 Operand Stack
- Covers
- Interpreter · Bytecode execution · Startup
- Related
- 1.2 JIT · 1.4 Tiered Compilation · 4.1 Startup Performance
On this page
1Concept / Definition
Interpretation is executing bytecode directly, instruction by instruction, without first translating the method into machine code. HotSpot's default is a template interpreter: at JVM startup it generates a small machine-code routine (a *template*) for every bytecode and, at run time, dispatches from one template to the next through a table. Every method starts life in the interpreter (tier 0); the interpreter executes it correctly from the first call and counts invocations and loop iterations so the JIT knows which methods deserve compilation.

2Why It Exists
- Immediate execution — no compile delay before the first instruction runs; most methods in a program are executed only a few times and never deserve compilation.
- Hot-code discovery — counters in the interpreter identify the small set of methods worth compiling.
- Safety net — whenever compiled code is discarded (deoptimisation, Chapter 3) or a rarely used path is hit, execution continues correctly in the interpreter.
- Portability of the VM itself — templates are generated per CPU at startup; a pure C++ interpreter (the *Zero* port) exists for platforms without a JIT.
3Core Concepts
Interpreter
Template interpreter
- Generated at startup into the code cache's non-method segment (a few hundred KB).
- One template per bytecode and top-of-stack state (the value on top of the operand stack is cached in a CPU register — *TOS caching* — e.g.
raxfor ints on x64). - Each template ends with dispatch: load the next opcode at the bytecode pointer (
bcp), index the dispatch table, jump. - Separate tables let the VM switch behaviour cheaply — for example to check for safepoints or to support debugging.
What the interpreter maintains
| Register / structure | Role |
|---|---|
| bcp (bytecode pointer) | address of the current bytecode in the method |
| locals pointer | base of the frame's local variable array |
| expression stack pointer | top of the operand stack |
| method / constant-pool cache | resolved fields and methods (B2V1 3.3) |
| MethodCounters | invocation and back-edge counters |
| MethodData (when profiling) | branch, type and null profiles |
Counting versus profiling
With tiered compilation the interpreter always counts (invocations, loop back-edges). Detailed profiles — which branch is taken, which receiver types appear at a call site — are mostly collected by C1-compiled tier-3 code (1.4). The interpreter starts profiling itself only if a method keeps running interpreted well past the tier-3 thresholds, for example because C1's queue is long (Tier0ProfilingStartPercentage, default 200%).

Bytecode execution
Executing a method
- The caller's invoke instruction creates an interpreter frame: locals (overlapping the caller's pushed arguments), frame data (method, constant-pool cache, bcp, monitors) and an empty expression stack.
- The first template of the method's first bytecode runs; each template performs its operation on locals and the expression stack, advances
bcpand dispatches. - Invocations check whether the callee has compiled code; if so, they jump to it through an adapter (i2c: interpreted-to-compiled), otherwise they enter the interpreter again.
- Returns pop the frame and push the result on the caller's expression stack.
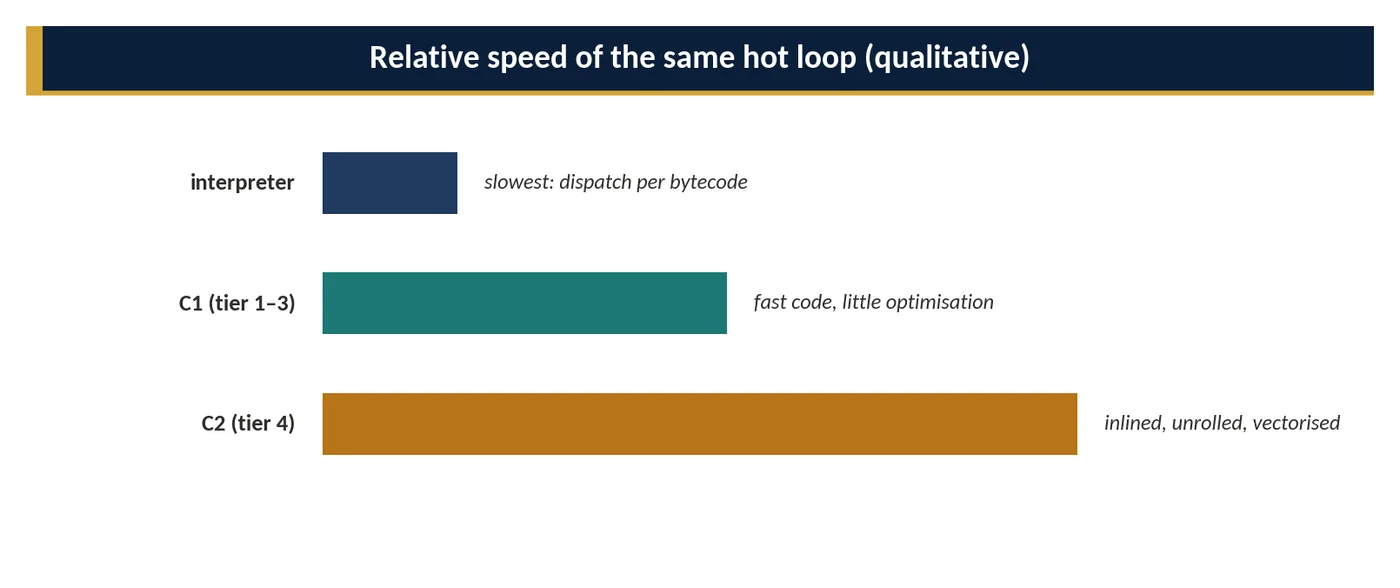
Costs per bytecode
- Indirect jump per instruction (branch-predictor unfriendly).
- Operand-stack values mostly in memory, not registers.
- No inlining, no constant folding, no loop optimisation; every array access and field access is a full operation.
- Checks the JIT would remove (null, bounds, casts) execute every time.
Rewriting
After first resolution, many instructions are rewritten to faster internal forms (e.g. getfield → a *fast_*getfield variant with the resolved offset), removing lookups on later executions (B2V1 3.3).
Startup
Phases
- Launcher creates the VM; templates and stubs are generated; the CDS archive is mapped.
- Core classes are loaded (mostly from CDS) and initialised; the system class loader is created.
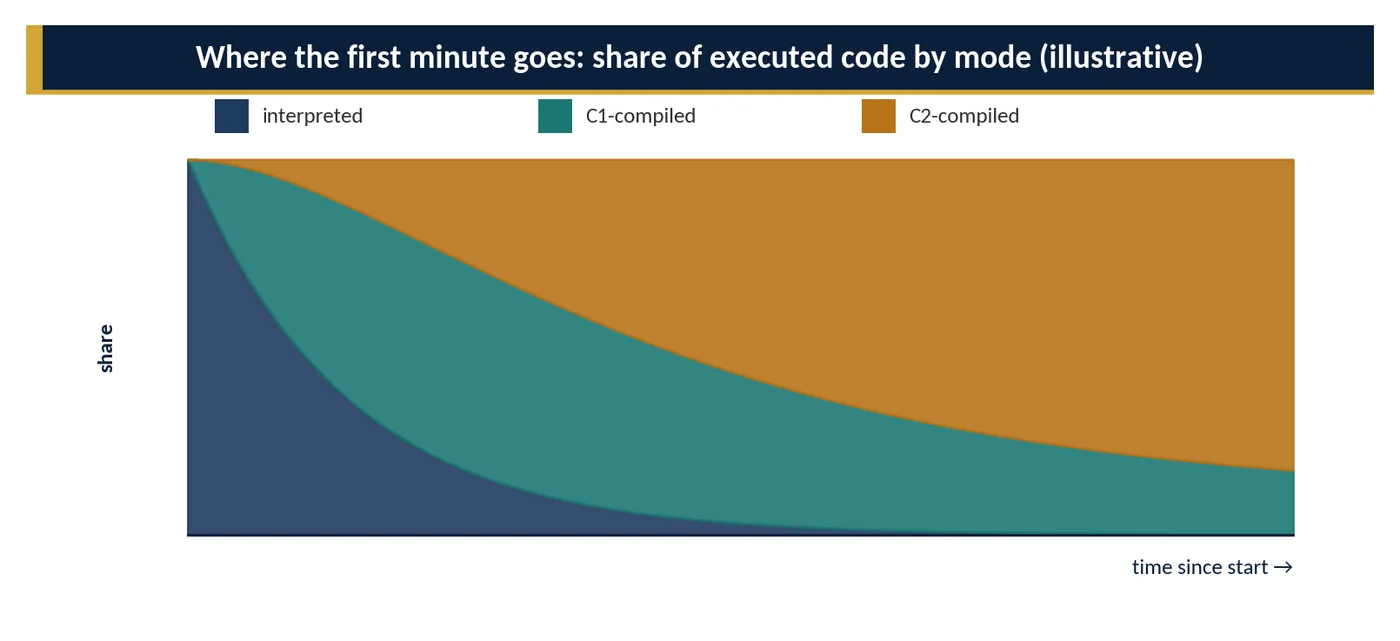
- The main class runs interpreted; framework bootstrapping loads thousands of classes, nearly all of whose methods run only a few times — in the interpreter.
- Hot startup paths (class-path scanning, parsing, reflection) quickly cross thresholds and move to C1, then C2.
Why startup is interpreter-heavy
Startup code is wide and shallow: many methods, each run a few times. Compiling them would cost more than interpreting them. That is why startup time depends mostly on class loading, initialisation and interpretation — and why techniques that avoid work (CDS, AOT cache, fewer classes, lazy initialisation) help more than faster compilers.
Execution modes

4How It Works Internally
TemplateInterpreterGenerator emits machine code for each bytecode and TOS state into the code cache at startup; TemplateTable defines each bytecode's code. Method entry points are generated per method *kind* (normal, synchronized, native, accessor-like intrinsic entries such as Math.sin). Transitions between interpreted and compiled code go through i2c/c2i adapters that move arguments between the interpreter's stack layout and the compiled calling convention. Safepoint and handshake polls are performed at method returns and backward branches.
5APIs / Features / Syntax
# Interpreter only: shows how slow pure interpretation is
$ java -Xint -jar bench.jar
$ java -Xmixed -jar bench.jar            # default: interpreter + tiered JIT

# Where does startup time go?
$ java -Xlog:startuptime -jar app.jar                  # VM phases
$ java -Xlog:class+load:file=cl.log -jar app.jar ; wc -l cl.log
$ java -XX:StartFlightRecording=duration=60s,filename=startup.jfr -jar app.jar
$ jfr view hot-methods startup.jfr  # where CPU went (JDK 21+ views)

# Interpreter internals (diagnostic)
$ java -XX:+UnlockDiagnosticVMOptions -XX:+PrintInterpreter -version | head
# (needs the hsdis plugin to show disassembly)6Practical Examples
// A tight loop timed badly: most iterations run interpreted or in OSR code
long t0 = System.nanoTime();
long sum = 0;
// too short to reach C2 → measures the interpreter
for (int i = 0; i < 10_000; i++) sum += i * i;
System.out.println(System.nanoTime() - t0);

// Same work measured correctly: JMH warms up (interpreter → C1 → C2) before measuring
@Benchmark public long squares() {
    long s = 0;
    for (int i = 0; i < 10_000; i++) s += (long) i * i;
    return s;
}| Observation | Interpretation-related explanation | Response |
|---|---|---|
| First requests 10–50× slower than later ones | methods still interpreted or in C1 | warm-up before readiness; AOT cache |
| CLI tool runs 300 ms, mostly startup | wide, shallow code in interpreter | AppCDS/AOT cache; fewer dependencies; Native Image |
| -Xint run takes forever | no JIT at all | use only for diagnosis |
| Startup CPU high in small pod | interpreter + JIT threads + class loading | more CPU at start; CDS; lazy init |
7Common Problems & Mistakes
- Micro-benchmarks without warm-up — they measure interpreted code.
- Assuming 'Java is slow' from startup or first-request timings.
- Using
-Xcompto 'avoid interpretation' — compiles everything with poor profiles; slower startup and often slower steady state. - Expecting a faster JIT to fix slow startup — startup is dominated by loading, initialisation and interpretation of code that never gets hot.
8Performance & Production Considerations
- Plan for warm-up in deployments: readiness after warm-up traffic, gradual traffic shifting, pre-scaling ahead of peaks.
- CDS (default archive for JDK classes), AppCDS and the JDK 24+ AOT cache reduce class loading and linking; JDK 25's AOT method profiling (JEP 515) lets the JIT start from profiles gathered in a training run.
- Give containers enough CPU during startup; interpreter, class loading and compiler threads compete.
9Architecture & Design Considerations
The interpreter-first model favours long-running processes: the longer an instance lives, the more its startup and warm-up cost is amortised. Short-lived executions (functions, jobs, CLI tools, scale-to-zero) pay the cost every time. Architecture choices — instance lifetime, autoscaling policy, pre-warming, AOT cache or Native Image — should reflect this.
10Interview Questions & Answers
Does the JVM interpret or compile Java code?
Both. Every method starts running in HotSpot's interpreter, which executes bytecode directly without compiling it. The JVM counts how often each method is called and how many loop iterations run. When a method becomes hot, it is compiled to native code by the C1 compiler, which compiles quickly and collects profiling data, and if it stays hot it is recompiled by the C2 compiler, which uses that profile to produce highly optimised code. This tiered approach gives fast start-up for code that runs rarely and near-native speed for the code that matters. Other approaches, such as Native Image, compile everything ahead of time instead.
What is HotSpot's template interpreter?
HotSpot's template interpreter generates a small machine-code routine, called a template, for each bytecode instruction when the JVM starts. To execute a method, it jumps from one template to the next through a dispatch table indexed by the bytecode, rather than running a loop written in C. It keeps the value at the top of the operand stack in a CPU register to avoid memory traffic. This makes interpretation much faster than a naive interpreter, though still far slower than compiled code. The interpreter also updates invocation and loop counters, which tell the JIT compilers which methods are worth compiling.
Why doesn't the JVM compile everything before running it?
Compilation is expensive, and most methods in a typical application run only a handful of times, for example during start-up or configuration. Compiling all of them up front would make start-up slow and waste CPU on code that never matters. Interpreting first gives immediate execution, and lets the JVM spend compilation effort only on hot methods. It also has a quality benefit: by the time a method is compiled, the JVM has observed real behaviour, such as which types actually reach a call site and which branches are taken, so the JIT can optimise for what really happens rather than what might happen.
Why is startup dominated by interpretation and class loading?
Start-up runs a very wide range of code, each part only a few times: framework bootstrapping, classpath scanning, configuration parsing, dependency injection and reflection. Few of these methods get hot enough to be compiled, so the JVM spends most of start-up loading and verifying classes, running static initialisers and interpreting code once. A Spring Boot service may load tens of thousands of classes before it serves its first request. That is why start-up improvements focus on loading fewer classes, doing less work eagerly and reusing work across runs with class-data sharing or the AOT cache, rather than on faster compiled code.
Why do naive timing loops give misleading Java benchmark results?
A simple loop that times a method a few thousand times usually measures the wrong thing. Early iterations run in the interpreter or in C1-compiled code, so they are much slower than steady state. If the result is not used, C2 may remove the computation entirely as dead code, giving impossibly fast results. On-stack replacement, garbage collection and CPU frequency changes add noise. JMH, the Java Microbenchmark Harness, handles these problems: it runs warm-up iterations, forks fresh JVMs, consumes results through a Blackhole and reports statistical error. Even then, confirm important conclusions with tests under realistic load.
How would you reduce the cost of interpretation-heavy startup for a service that scales frequently?
Attack start-up from several sides. Reduce the work: fewer classes on the classpath, lazy initialisation of beans that are not needed immediately, and less reflection and classpath scanning. Reuse work across runs: application class-data sharing, or the AOT cache introduced in JDK 24, which in JDK 25 can also store method profiles so the JIT warms up faster. Give the container enough CPU during start-up, because JIT compilation competes with application threads, and warm critical code paths before the readiness probe passes. If start-up still dominates, for example in scale-to-zero platforms, evaluate GraalVM Native Image and its trade-offs.