 Architect

- Prerequisites
- Book 2 Volume I 1.2 (JVM architecture)
- Covers
- Purpose · Allocation · Shared heap · Sizing
- Related
- 2.5 Object Allocation · Chapter 4 GC Fundamentals · 7.2 OOM Types
On this page
1Concept / Definition
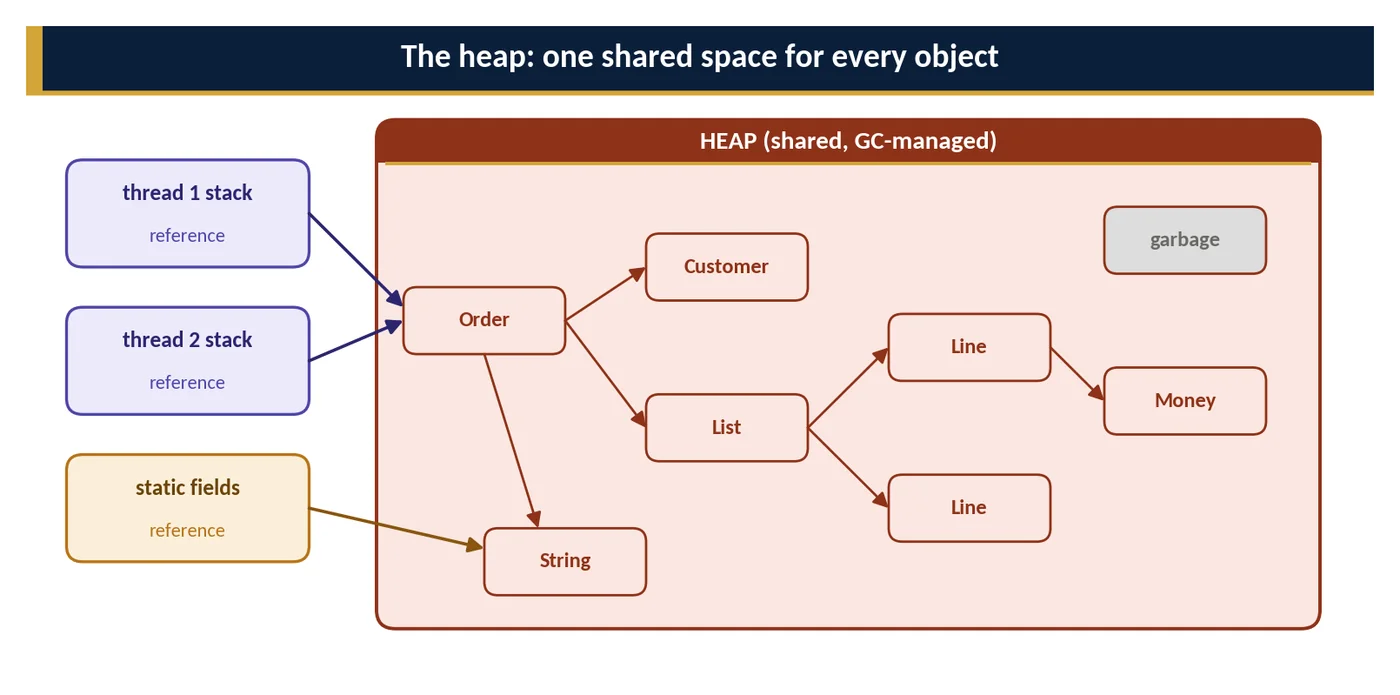
The heap is the JVM runtime data area from which memory for all class instances and arrays is allocated (JVMS §2.5.3). It is created at JVM startup, shared by all threads of the process, and managed by the garbage collector, which reclaims objects that are no longer reachable. The heap has an initial size, may grow to a configurable maximum, and throws OutOfMemoryError: Java heap space when an allocation cannot be satisfied even after collection.
| Property | Value / behaviour |
|---|---|
| Lifetime | created at JVM start, destroyed at exit |
| Scope | one per JVM process, shared by all threads |
| Contents | objects, arrays; in HotSpot also Class mirrors (holding static fields) and interned strings |
| Management | automatic — garbage collector; no explicit free |
| Bounds | -Xms / -Xmx or RAM percentages; reserved up front, committed on demand |
| Failure | OutOfMemoryError: Java heap space (or GC overhead limit exceeded with Parallel GC) |
2Why It Exists
Objects in Java routinely outlive the method call that created them and are shared between threads — a request object handed to a worker thread, an entry placed in a cache, a message queued for later processing. Stack frames are private to one thread and disappear when the method returns, so they cannot hold such objects. A single, collector-managed heap solves both problems and additionally enables:
- Very cheap allocation — contiguous free space allows bump-pointer allocation.
- Compaction — the collector can move objects to eliminate fragmentation, because programs only hold references, never raw addresses.
- Memory safety — no dangling pointers or double frees; memory is reclaimed only when unreachable.
3Core Concepts
Purpose
What lives in the heap
- Every object created with
new, including records, enums' constants, lambdas' captured-state objects and boxed primitives. - Every array, primitive or reference.
- In HotSpot:
java.lang.Classmirror objects (which hold static field values), interned strings (the string table references heap strings), and objects created by the JVM itself (exceptions, reflection data).
What does not
- Local variables and operand values — in thread stacks (1.2).
- Class metadata (method bytecode, vtables, constant pools) — in Metaspace (1.5).
- JIT-compiled code — in the code cache.
- Direct buffers' contents and other native allocations — off-heap (1.6).
The heap as an object graph
Objects reference each other, forming a directed graph whose entry points are GC roots: stack slots, static fields, JNI handles and others (3.3). The collector keeps every object reachable from a root and treats the rest as garbage. The heap's steady-state occupancy after collection — the live set — is the most important number for sizing.
Allocation
Fast path
Almost all allocations are performed by bump-pointer allocation inside a Thread-Local Allocation Buffer (TLAB) — a chunk of the young generation (Eden) owned by one thread. Allocation is: read top, add the object size, compare with end, store the new top, write the header. JIT-compiled code inlines these few instructions; no lock or atomic operation is involved.

Slow paths
- TLAB refill — the TLAB is exhausted; the thread takes a new TLAB from Eden with an atomic compare-and-swap on the shared Eden pointer.
- Allocation outside TLAB — the object is larger than the remaining TLAB space or a waste threshold; it is allocated directly in Eden.
- Large objects — G1 allocates objects ≥ half a region as humongous regions; ZGC uses large pages; Parallel may allocate directly in old space.
- GC — when Eden cannot supply space, a young collection runs and the allocation is retried; after a full GC without success,
OutOfMemoryErroris thrown.
Allocation avoided
C2's escape analysis can prove that an object never escapes a compiled method and replace it with scalar values in registers (scalar replacement). Such objects never touch the heap. This is why short-lived helper objects in hot code are often free (3.1).
Shared heap
Visibility and safety
Because the heap is shared, any object can be reached from several threads. The Java Memory Model defines when writes made by one thread become visible to another (happens-before via synchronized, volatile, final fields, concurrent collections). Sharing is the source of data races; immutable objects and thread confinement are the standard mitigations (Book 2 concurrency volume).
Contention-free allocation
TLABs make allocation contention-free despite sharing: each thread allocates privately and only coordinates when fetching a new TLAB.
Internal organisation depends on the collector

| Collector | Heap structure | Implication |
|---|---|---|
| Serial / Parallel | contiguous young (Eden, S0, S1) and old generations | whole-generation collections; simple and efficient |
| G1 (default) | equal-sized regions with dynamic roles | partial collections; pause-time goal |
| ZGC | small, medium and large pages; generational | concurrent relocation; sub-ms pauses |
| Shenandoah | regions; generational mode available | concurrent evacuation |
Sizing
Reserved, committed, used
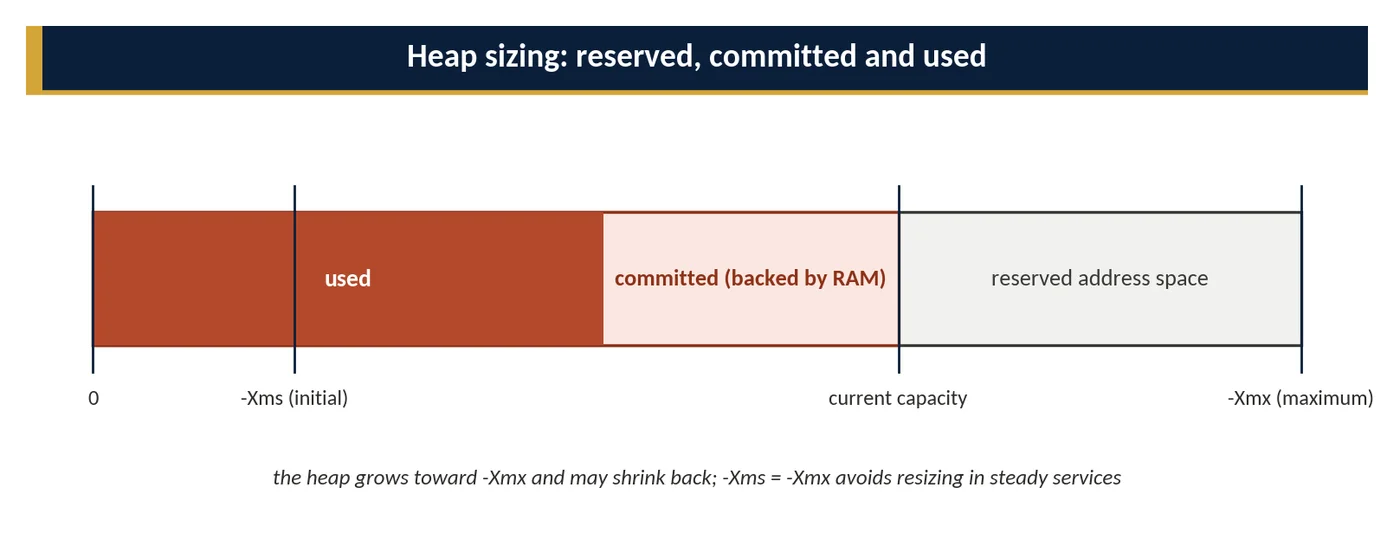
- Reserved — virtual address space set aside for the maximum heap at startup (costs no RAM).
- Committed — the portion backed by memory the OS has granted; grows from the initial size toward the maximum.
- Used — the portion currently occupied by objects (live plus not-yet-collected garbage).
Setting the size
| Option | Meaning | Notes |
|---|---|---|
| -Xms / -XX:InitialHeapSize | initial committed heap | equal to -Xmx avoids resizing |
| -Xmx / -XX:MaxHeapSize | maximum heap | hard limit for heap OOM |
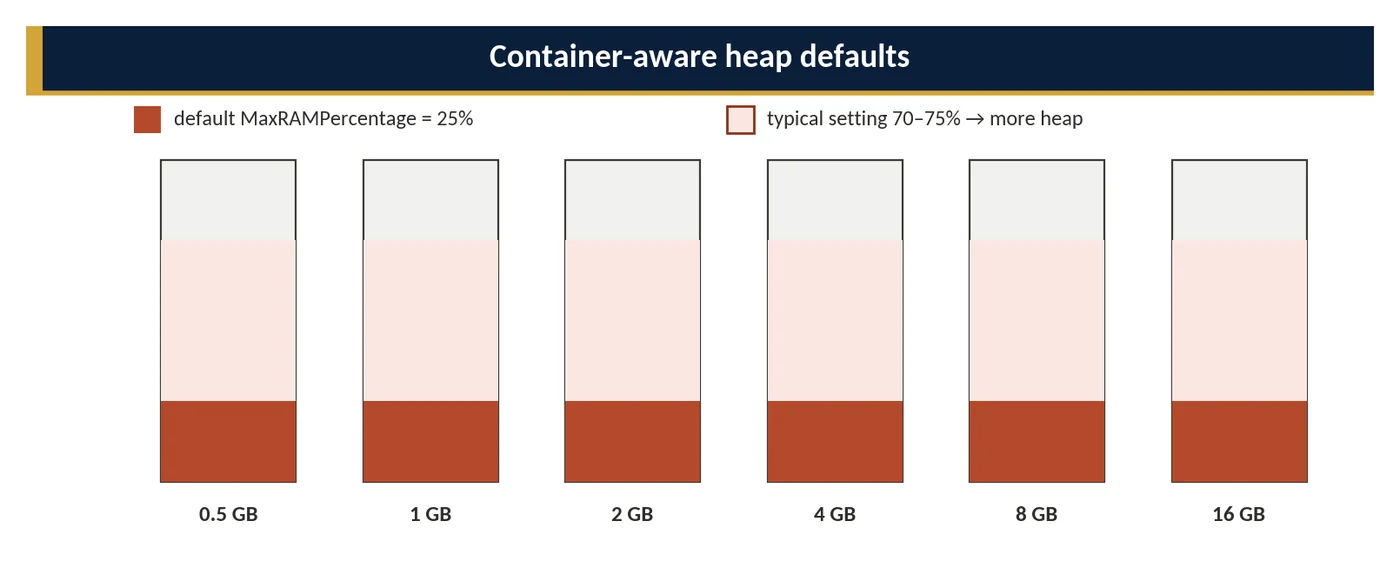
| -XX:MaxRAMPercentage | max heap as % of available memory | default 25; container-aware |
| -XX:InitialRAMPercentage | initial heap as % | default 1.5625 |
| -XX:MinRAMPercentage | max heap % for very small memory | default 50 (applies below ~250 MB) |
| -XX:+AlwaysPreTouch | touch all pages at startup | avoids page-fault latency later; slower start |
| -XX:SoftMaxHeapSize | soft limit the GC tries to stay under | supported by ZGC |
Growth and shrinking
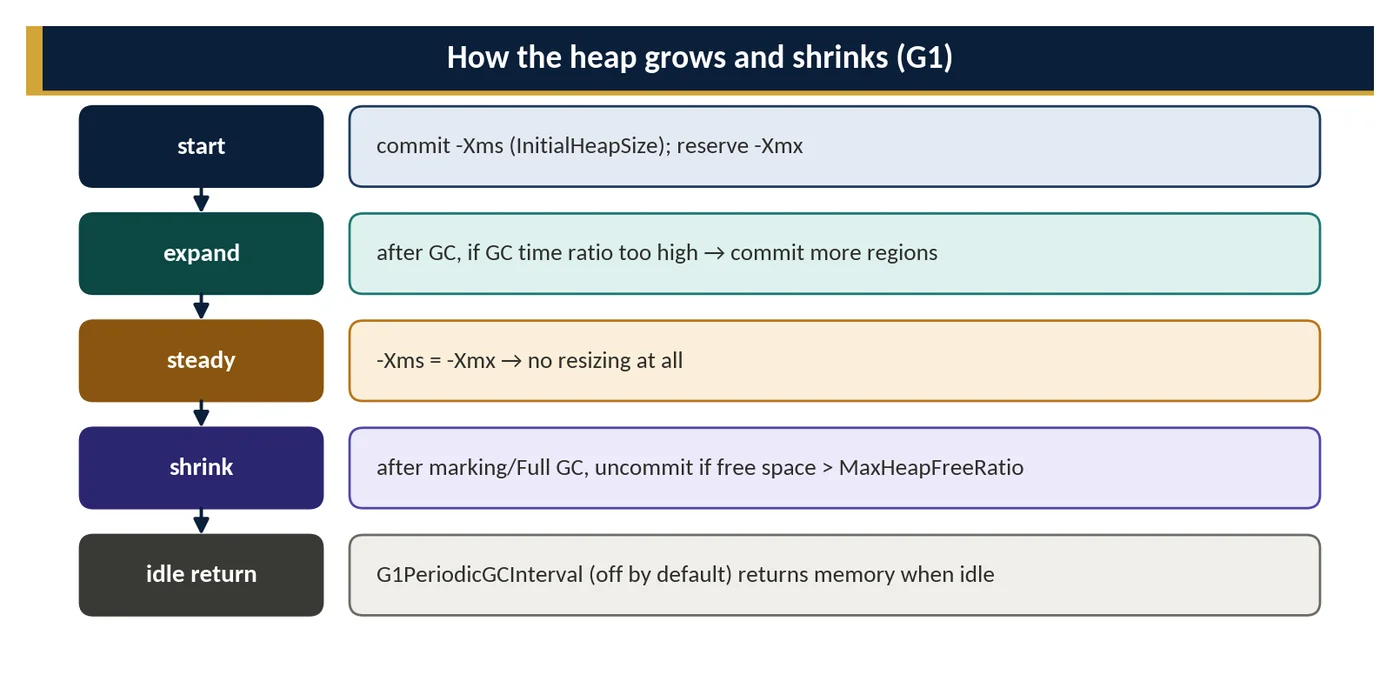
With -Xms below -Xmx, collectors expand the committed heap when GC time is high relative to application time (GCTimeRatio) and may shrink it when free space exceeds MaxHeapFreeRatio. Resizing costs GC work and makes memory usage variable; services in containers usually fix the size.
Compressed oops
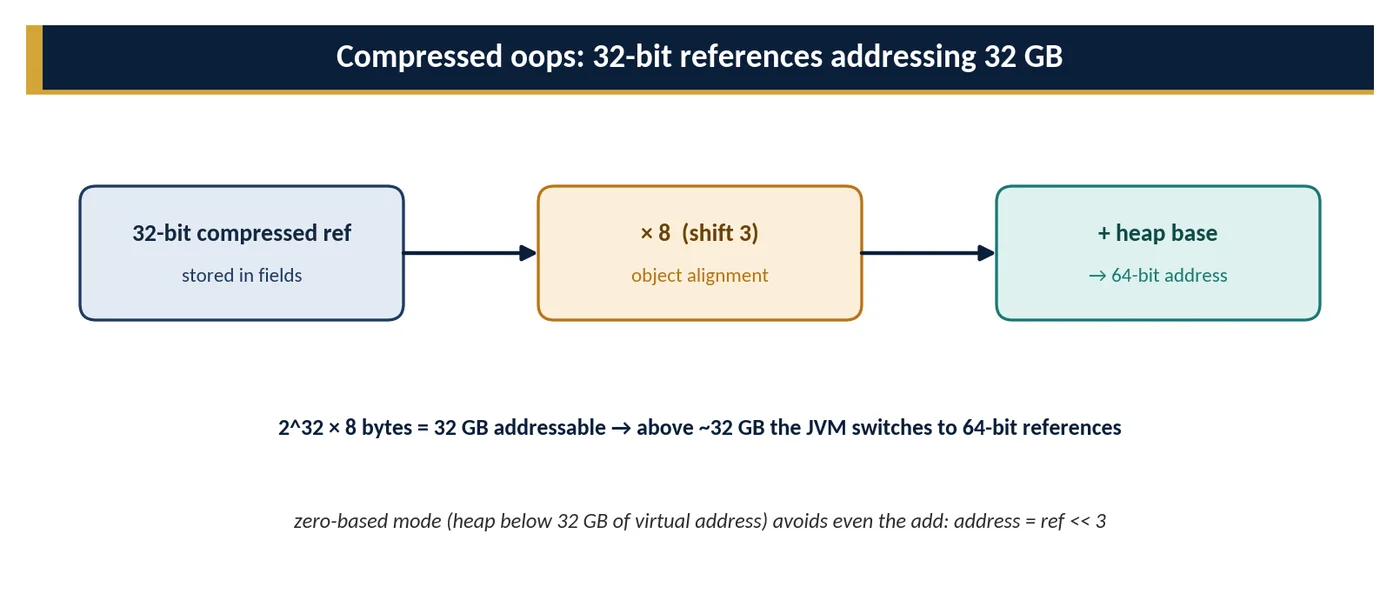
On 64-bit JVMs with a maximum heap below about 32 GB, references are stored as 32-bit compressed oops: offsets divided by the 8-byte object alignment. This saves roughly a third of heap in pointer-heavy data. Crossing the threshold switches to 64-bit references, so a 34 GB heap can hold less data than a 31 GB heap.
4How It Works Internally
- At startup HotSpot reserves one contiguous virtual address range for
-Xmx(plus alignment) and commits the initial size. - The collector partitions the range into its structures and maintains side data in native memory: card table (1 byte per 512 heap bytes), mark bitmaps, remembered sets, region tables. These appear under 'GC' in Native Memory Tracking and scale with heap size.
- Allocation state (TLAB top/end) lives in each thread's JVM structure; Eden's shared top pointer is updated with atomic operations.
- The heap is part of the process's resident memory only for committed and touched pages —
AlwaysPreTouchmakes all committed pages resident immediately.
5APIs / Features / Syntax
# What did the JVM choose? (container-aware)
$ java -XX:MaxRAMPercentage=75 -XX:+PrintFlagsFinal -version | grep -E " MaxHeapSize| InitialHeapSize| UseCompressedOops"
   size_t InitialHeapSize   = 134217728     {product} {ergonomic}
   size_t MaxHeapSize       = 3221225472    {product} {command line}
     bool UseCompressedOops = true          {product lp64_product} {ergonomic}

# Live process
$ jcmd <pid> GC.heap_info
$ jcmd <pid> VM.flags | tr ' ' '\n' | grep -E "HeapSize|RAMPercentage"
$ jstat -gc <pid> 1s # capacity (C) and usage (U) per space every secondMemoryMXBean mem = ManagementFactory.getMemoryMXBean();
MemoryUsage heap = mem.getHeapMemoryUsage(); // init, used, committed, max
log.info("heap used={} MB committed={} MB max={} MB",
heap.getUsed() >> 20, heap.getCommitted() >> 20, heap.getMax() >> 20);
for (MemoryPoolMXBean p : ManagementFactory.getMemoryPoolMXBeans()) {
if (p.getType() == MemoryType.HEAP) {
// usage right after the last GC → live-set indicator
MemoryUsage afterGc = p.getCollectionUsage();
log.info("{} after last GC: {} MB", p.getName(), afterGc == null ? -1 : afterGc.getUsed() >> 20);
}
}6Practical Examples
Sizing scenarios
| Scenario | Container limit | Heap setting | Reasoning |
|---|---|---|---|
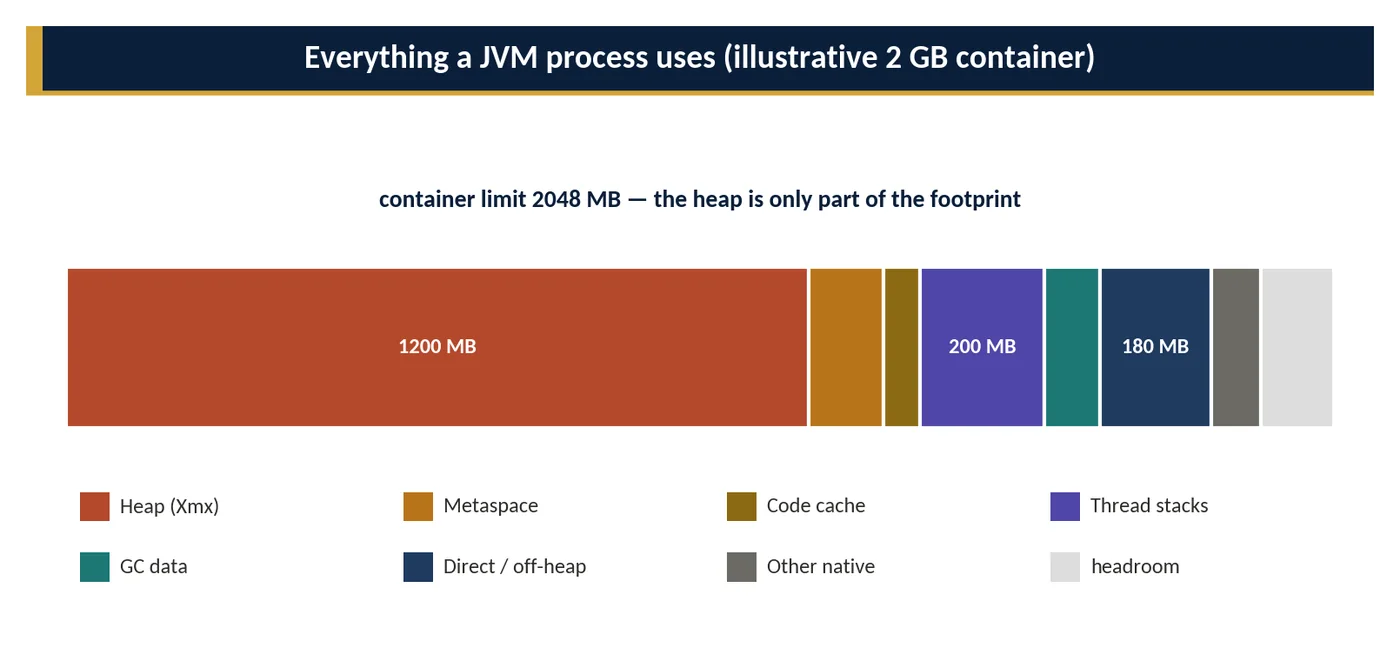
| Typical REST service | 2 GB | MaxRAMPercentage=75 (1.5 GB) | ~500 MB for Metaspace, threads, code cache, buffers |
| Netty gateway | 2 GB | MaxRAMPercentage=50 | large direct-buffer pools need native memory |
| Batch job | 8 GB | -Xms6g -Xmx6g -XX:+AlwaysPreTouch | predictable, no resizing, no page-fault stalls |
| Cache node | 64 GB | -Xmx31g | keep compressed oops; or go much larger with ZGC |
| Small sidecar | 256 MB | MaxRAMPercentage=60 | tiny heap; check thread and Metaspace overhead |
Deriving heap size from the live set
# 1. Load test at peak traffic with GC logging
# 2. Extract old-generation occupancy after mixed/full GCs (live set)
$ grep -E "Pause Young \(Mixed\)|Pause Full" gc.log | tail -5
[..] GC(812) Pause Young (Mixed) (G1 Evacuation Pause) 2890M->1210M(4096M) 38.2ms
# live set ≈ 1.1–1.2 GB → heap 2.5–4 GB (2–3.5×) → container ≈ heap / 0.757Common Problems & Mistakes
| Mistake | Consequence | Fix |
|---|---|---|
| No heap flags in containers | Heap = 25% of limit; frequent GC; wasted memory | Set MaxRAMPercentage (≈70–75) |
| -Xmx equal to container limit | OOM-kill from non-heap memory | Leave 25–35% headroom |
| Heap just above 32 GB | Compressed oops lost, less usable space | Stay ≤ 31 GB or go well beyond |
| Heap sized from 'used' not live set | Over- or under-sizing | Use post-GC occupancy |
| Increasing heap to fix a leak | Delays failure only | Find retention (Chapter 7) |
| Resizable heap in latency-sensitive services | Resize GCs, variable RSS | -Xms = -Xmx |
8Performance & Production Considerations
- Allocation rate (MB/s) drives young-GC frequency; heap size only changes how often, not how much work per byte allocated.
- Live set determines old-generation work; heap headroom over it determines how comfortably the collector operates.
- Heap dumps on OOM need disk space equal to used heap; plan persistent volumes.
- Monitoring: heap after GC (trend), committed heap, allocation rate, and container RSS versus limit on one dashboard.
- Page faults: first-touch of heap pages costs latency;
AlwaysPreTouchmoves this to startup.
9Architecture & Design Considerations
Heap sizing is capacity planning. It interacts with deployment topology and data design:
- Many small instances — lower pause impact and blast radius, but fixed per-JVM overhead (Metaspace, code cache, threads) repeats in every instance.
- Few large instances — more efficient memory use, but larger live sets demand low-latency collectors (ZGC) and longer restarts.
- In-process state (caches, sessions, large buffers) must be justified against its heap and GC cost; external caches or streaming often scale better.
10Interview Questions & Answers
What is stored in the Java heap?
The heap holds every object and array the application creates, whether with new, through reflection or by deserialisation. In HotSpot it also holds the java.lang.Class mirror objects, which contain static field values, and the table of interned strings. It does not hold local variables and method call frames, which live on each thread's stack, or class metadata, which lives in Metaspace, or JIT-compiled code, which lives in the code cache. This distinction matters when diagnosing memory problems: an OutOfMemoryError can name the heap, Metaspace or direct memory, and each needs a different fix.
What do -Xms and -Xmx control?
- Xms sets the initial size of the committed heap and -Xmx sets the maximum size it may grow to. If they differ, the JVM starts small and grows or shrinks the heap after garbage collections, which costs some work and can make memory usage less predictable. For long-running services, setting them equal avoids resizing and makes the memory footprint stable, which helps capacity planning and container sizing. In containers, the percentage-based flags -XX:InitialRAMPercentage and -XX:MaxRAMPercentage are often preferred, because they follow the container's memory limit automatically when it changes.
Why is the heap shared between threads, and what does that imply?
Objects are created by one method and often used by others, possibly on different threads and long after the creating method has returned. They therefore live in one shared area rather than on a thread's stack. Sharing makes it easy to pass data between threads, but it also makes data races possible: two threads can read and write the same object concurrently. The Java Memory Model defines when one thread's writes become visible to another, and synchronisation tools such as locks, volatile fields and concurrent collections provide the guarantees. Immutable objects avoid most of these problems, which is one reason records are popular.
What is a TLAB and why does it matter?
A thread-local allocation buffer, or TLAB, is a small chunk of the young generation reserved for one thread. When the thread allocates an object, it simply moves a pointer forward within its own buffer, with no locking and no contention with other threads, so allocation takes only a few machine instructions. When the buffer fills up, the thread gets a new one, which is the only point that needs coordination. TLABs are why allocating short-lived objects in Java is very cheap. Very large objects, or allocations when no TLAB is available, take a slower path that may allocate directly in the shared heap.
What is the default maximum heap in a container without flags?
Without explicit heap flags, a modern JVM reads the container's memory limit and sets the maximum heap to 25% of it, the default value of -XX:MaxRAMPercentage; for very small limits it uses a larger share. For a container with a 2 GiB limit that gives a heap of about 512 MiB, leaving most of the memory unused by the application. For a dedicated service this is usually too conservative, so teams set MaxRAMPercentage to around 70 to 75%, leaving the remainder for metaspace, thread stacks, code cache and direct buffers. Always verify the result with -XX:+PrintFlagsFinal.
What is the difference between reserved, committed and used heap?
Reserved memory is the virtual address range the JVM sets aside at start-up for the maximum heap; it costs almost nothing. Committed memory is the part the JVM has actually asked the operating system to back with real memory, and it can grow up to the reserved size. Used memory is the part of the committed heap currently occupied by objects. Monitoring tools often show used memory, but container limits and the process's resident set size relate to committed and touched memory. So a service can show 40% heap used yet be close to its container limit, because the heap is fully committed and non-heap memory adds to it.
What are compressed oops and why does the 32 GB threshold matter?
On a 64-bit JVM, each object reference could take 8 bytes. With compressed ordinary object pointers, HotSpot stores references as 32-bit values and multiplies them by the 8-byte object alignment, which can address up to about 32 GB of heap. This saves a lot of memory, because references are everywhere in object graphs. Above roughly 32 GB the JVM must switch to full 64-bit references, so every reference doubles in size. As a result, a heap of 34 GB may hold less useful data than a heap of 31 GB. Either stay below the threshold or go well above it, for example to 48 GB or more.
How do different collectors lay out the heap?
Each collector organises the heap to suit its algorithm. Serial and Parallel use two contiguous generations: a young generation with Eden and survivor spaces, and an old generation, each collected as a whole. G1 divides the heap into many equal-sized regions, typically 1 to 32 MB, whose roles as Eden, survivor, old or humongous change over time, so it can collect the regions with the most garbage first. ZGC uses pages of different sizes and, since JDK 21, is also generational, with most work done concurrently. The layout determines whether a collection must process a whole generation or can work incrementally, which drives pause times.
How would you size the heap for a new service?
Measure rather than guess. Run a load test at expected peak traffic with GC logging enabled, and find the live set: the heap occupancy just after full or old-generation collections. Also note the allocation rate. Choose a heap of about two to four times the live set, adjusting until GC frequency and pause times meet your latency targets, and set -Xms equal to -Xmx. Then size the container limit with 25 to 35% headroom above the heap for metaspace, threads, code cache and direct memory, and verify it with Native Memory Tracking and the process's resident memory under load. Revisit the numbers after major releases.
Why might increasing -Xmx not fix OutOfMemoryError?
A bigger heap only helps if the application genuinely needs more live data. If the cause is a memory leak, a larger heap just delays the failure, and makes the eventual heap dump bigger and slower to analyse. Many OutOfMemoryErrors are not heap problems at all: Metaspace exhaustion from class-loader leaks, direct buffer exhaustion, or the inability to create native threads are unaffected by -Xmx. In a container, raising -Xmx without raising the limit can also push total memory over the limit, so the kernel kills the process instead. Read the error message and a heap dump before changing sizes.
How do heap-sizing choices influence service architecture?
Heap size drives instance size, and instance size shapes the architecture. Services that keep large datasets in memory, such as caches or analytics engines, need big heaps, which push towards fewer, larger instances, concurrent collectors such as ZGC and careful attention to failure impact, because losing one instance loses a lot of capacity. Stateless services with modest heaps can run as many small instances, scale in fine increments and tolerate the loss of any one. Heap size also affects cost per request and start-up behaviour. Architects should choose deliberately: externalise state to keep heaps small, or accept the operational demands of large-memory instances.