 Architect

- Prerequisites
- 1.2 JVM Stack
- Covers
- PC register · Per-thread behavior · Native methods
- Related
- 1.4 Native Method Stack · B2V1 5.5 Execution Engine
On this page
1Concept / Definition
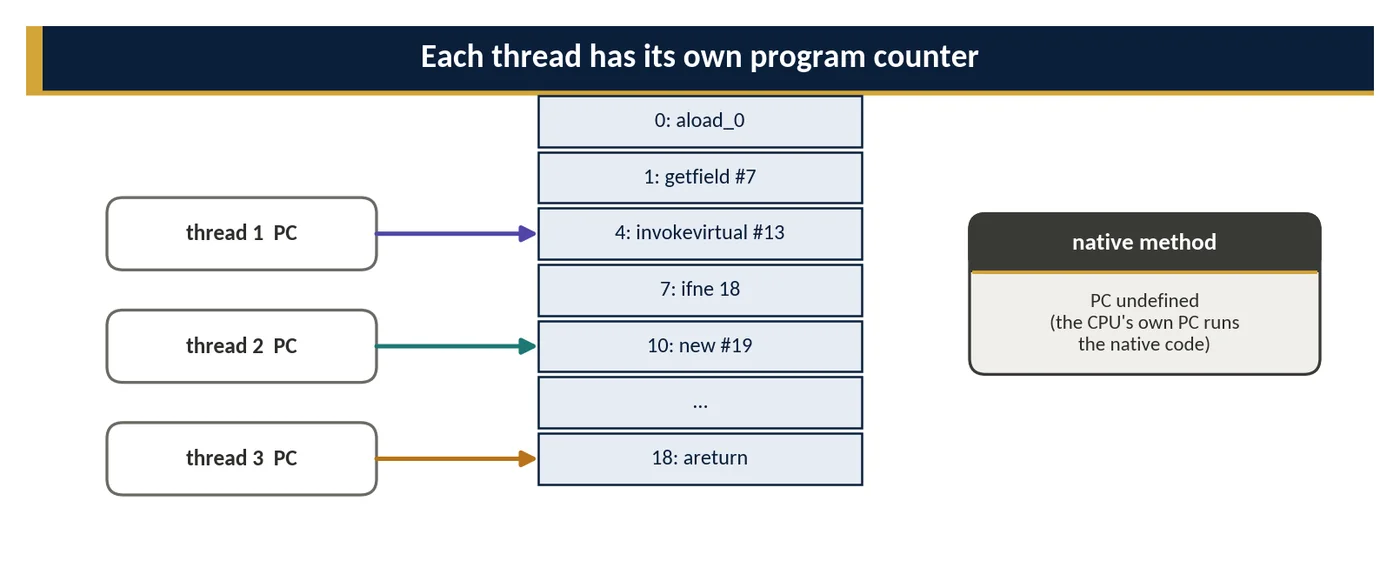
The program counter (PC) register (JVMS §2.5.1) holds the address of the JVM instruction currently being executed by a thread. Every thread has its own PC. If the current method is native, the PC's value is undefined. The PC is the smallest runtime data area and the only one for which the specification defines no OutOfMemoryError.
2Why It Exists
Many threads execute concurrently and are interleaved on CPUs by the OS scheduler. To resume a thread after preemption, the JVM must know exactly where in the bytecode it stopped. A per-thread PC, together with the thread's stack, is the complete description of "where the thread is".
The same position is what every diagnostic tool reports. A stack trace, a thread dump, a JFR execution sample and a debugger breakpoint all answer one question, which instruction each frame of a thread is at, and they derive the answer from the PC. Safepoints, deoptimisation and on-stack replacement depend on it too: the JVM can pause a thread for GC, or move it between interpreted and compiled code, only at a position it can describe exactly.
3Core Concepts
PC register
- In the interpreter, the PC is effectively a bytecode index (bci) into the current method's code array (in HotSpot the interpreter keeps a bytecode pointer in a register).
- It advances after each instruction by the instruction's length, and is changed by branches (
goto,if*), switches, invocations (callee starts at 0) and returns (caller resumes after the invoke). - In compiled code, the CPU's instruction pointer takes this role. Debug information maps each safepoint address back to a method and bci, which is how exceptions report line numbers (via the LineNumberTable) and how deoptimisation resumes in the interpreter at the right instruction.
Per-thread behavior
- Each thread owns its PC; two threads can execute the same method at different instructions simultaneously.
- When a thread is preempted or blocked, its PC and stack preserve its position; when rescheduled, it continues from there.
- Safepoints are reached at well-defined PCs — method returns and loop back-edges in compiled code — so the JVM can stop threads at points where their state is fully described.
Native methods
While a thread executes a native method, execution is in machine code outside the JVM's bytecode model, tracked by the CPU's instruction pointer; the JVM PC is undefined. HotSpot records that the thread is *in native*, which also lets GC safepoints proceed without waiting for it (1.4). When the native method returns, the caller's PC resumes after the invoke instruction.

4How It Works Internally
HotSpot does not maintain a separate PC memory area: the interpreter keeps the bytecode pointer in a dedicated register and saves it in the frame when calling out; compiled frames are described by the return address plus debug info. Tools that report positions — thread dumps, JFR stack samples, async-profiler — reconstruct method and bci from these.
On x86-64 the template interpreter keeps the bytecode pointer in register r13. Before it calls into the VM or invokes another method, it stores the pointer into a dedicated slot of the interpreter frame, so a stack walker can read the position of every interpreted frame from memory. For a compiled frame, the walker takes the frame's return address, finds the nmethod that contains it in the code cache and looks up the matching PcDesc entry, which points to a scope descriptor holding the method, the bytecode index and any inlined callers. Positions between recorded points are approximated to the nearest PcDesc unless -XX:+DebugNonSafepoints is enabled, which is why async-profiler recommends that flag.
5APIs / Features / Syntax
# Thread dumps show each thread's current position (method + line from the PC/bci)
$ jcmd <pid> Thread.print
"http-nio-8080-exec-3" #41 … runnable
   java.lang.Thread.State: RUNNABLE
        at com.shop.Pricing.total(Pricing.java:57)      ← line derived from the current bci
        at com.shop.OrderService.place(OrderService.java:31)

"reader-1" … runnable
at sun.nio.ch.SocketDispatcher.read0(Native Method) ← in native: no bytecode position6Practical Examples
Reading bytecode positions
The bytecode indexes printed by javap are exactly the values the PC takes while the interpreter runs a method. Compiling a small loop shows the advance by instruction length, the backward branch and the LineNumberTable that turns an index into a source line.
$ javap -c -l Pricing
  static int total(int[]);
       0: iconst_0                // int sum = 0      (line 3)
       1: istore_1
       2: aload_0                 // for (int p : ...) (line 4)
      ...
      10: iload         4         // loop header
      12: iload_3
      13: if_icmpge     33        // exit branch: PC jumps to 33
      ...
      27: iinc          4, 1
      30: goto          10        // back-edge: counter, safepoint poll
      33: iload_1                 // return sum        (line 5)
      34: ireturn
    LineNumberTable:
      line 3: 0
      line 4: 2
      line 5: 33
A thread reported at line 4 has a PC somewhere between 2 and 30; two threads summing different arrays can sit at 19 and 27 at the same moment, each with its own PC and frame. The goto at 30 is the back-edge where HotSpot counts loop iterations for OSR.
Reading the position from Java
// StackWalker exposes the position of every frame on the current thread
StackWalker.getInstance().forEach(f ->
    System.out.printf("%s.%s bci=%d line=%d%n",
        f.getClassName(), f.getMethodName(),
        f.getByteCodeIndex(), f.getLineNumber()));

// com.shop.Pricing.total bci=19 line=4
// com.shop.OrderService.place bci=42 line=31
getByteCodeIndex returns the caller's position at the invoke instruction for every frame except the top one, so the bci of an outer frame always points at a call.
7Common Problems & Mistakes
The most common misconception is treating the PC as something that can be sized, tuned or exhausted. It has no flag and no OutOfMemoryError; stack and thread problems come from the JVM stack and native memory instead. A second mistake is reading a frame marked Native Method as idle: the PC is undefined there, but the thread may be computing, waiting on a socket or stuck in a JNI call, and its state still shows RUNNABLE.
Missing position information is usually a build problem. Compiling with -g:none, or shrinking with tools that strip the LineNumberTable, turns every frame into Unknown Source; obfuscated builds need their mapping files archived with each release. Finally, positions in compiled code are approximate between debug points, so a sampling profiler can attribute time to a neighbouring line, especially when methods are inlined or the profiler only samples at safepoints.
8Performance & Production Considerations
Maintaining the PC costs nothing measurable, but turning positions into readable frames does. Creating a Throwable calls fillInStackTrace, which walks every frame and maps each PC to a method and bytecode index; exceptions thrown in hot paths or used for control flow pay for that walk each time. HotSpot's OmitStackTraceInFastThrow replaces frequently thrown implicit exceptions with a preallocated instance without a trace, which saves time but hides the origin, so watch for traceless NullPointerExceptions in logs. StackWalker is cheaper than Thread.getStackTrace because it walks lazily and can stop early.
For profiling, safepoint bias is the practical issue: a profiler that can only observe threads at safepoints reports the nearest poll, not the hot instruction. JFR and async-profiler avoid this, and -XX:+DebugNonSafepoints improves their line attribution at a small cost in code cache size. Keep the default javac line tables in production builds; they are tiny and make every incident easier to diagnose.
9Architecture & Design Considerations
The PC is rarely an architectural decision in itself, but its properties shape several. Because a thread's position is just a PC plus its frames, the JVM can save it anywhere. Virtual threads rely on this: when one parks, its frames, including the saved bytecode positions and return addresses, are copied into heap objects, so a server can hold a million suspended positions without a million OS threads.
Observability depends on positions too. Plan for them in the build pipeline: keep line tables, archive mapping files, and aggregate errors by stack signature so that one faulty line shows up as one incident rather than thousands. Code that crosses into native libraries through JNI or the Foreign Function and Memory API leaves the bytecode model, so keep those boundaries narrow and instrument them with timing and logging, because thread dumps and profilers cannot see the JVM position inside them.
10Interview Questions & Answers
What does the PC register hold?
The PC register holds the position of the JVM instruction that the thread is currently executing. In the interpreter that position is effectively a bytecode index, an offset into the current method's code array, which advances by each instruction's length and jumps on branches, switches, invocations and returns. A newly invoked method starts at index 0, and when it returns the caller continues after its invoke instruction. HotSpot keeps no separate memory area for it: the interpreter holds a bytecode pointer in a CPU register and saves it in the frame when it calls out. In JIT-compiled code, the CPU's instruction pointer plays the same role, with debug information mapping it back to bytecode.
Why must the PC be per thread?
Because each thread executes independently and can be at a different instruction, even in the same method, at the same moment. The OS scheduler interleaves threads on a limited number of cores and preempts them at arbitrary points, and threads also stop to wait for locks, I/O or a safepoint. To resume a thread exactly where it left off, the JVM needs that thread's own position plus its own stack of frames; together they describe its execution state completely. A shared PC could not say which thread was where. Being thread-private also means the PC needs no synchronisation, and because it has a fixed, tiny size it can never run out of memory.
What is the PC value while a native method runs?
The JVM specification says its value is undefined. A native method is machine code reached through JNI or the Foreign Function and Memory API, so there is no bytecode position to record; the CPU's instruction pointer tracks execution instead. HotSpot marks the thread as in native and leaves the caller's frame and saved bytecode position intact, so when the call returns the caller resumes after its invoke instruction. The in-native state also lets safepoints proceed without waiting for the thread. The tricky part for diagnosis is that a thread dump shows Native Method instead of a line, and the thread reports RUNNABLE even if it is blocked inside the native call.
How do stack traces for JIT-compiled code still show accurate line numbers?
Compiled code carries debug information produced by the JIT. At every safepoint, call site and implicit exception point, C1 or C2 records a mapping from the machine-code address to the method, the bytecode index and the location of each live value, including entries for methods that were inlined into the caller. When a stack trace is filled in, the JVM walks the frames, uses each return address to find the matching record in the nmethod, and maps the bytecode index to a source line through the method's LineNumberTable. Inlined methods are expanded so they appear as separate frames. The same records let deoptimisation rebuild interpreter frames and resume at exactly the right bytecode.