 Architect

- Prerequisites
- 1.1 Java Platform
- Covers
- .java source files · Compilation with javac · .class files · Bytecode · Class loading · JVM execution · Interpretation · JIT compilation · Program lifecycle
- Related
- 1.3 Language Characteristics · 2.1 Program Structure · Book 2 Vol I (class loading, bytecode) · Book 2 Vol III (JIT & HotSpot)
On this page
1Concept / Definition
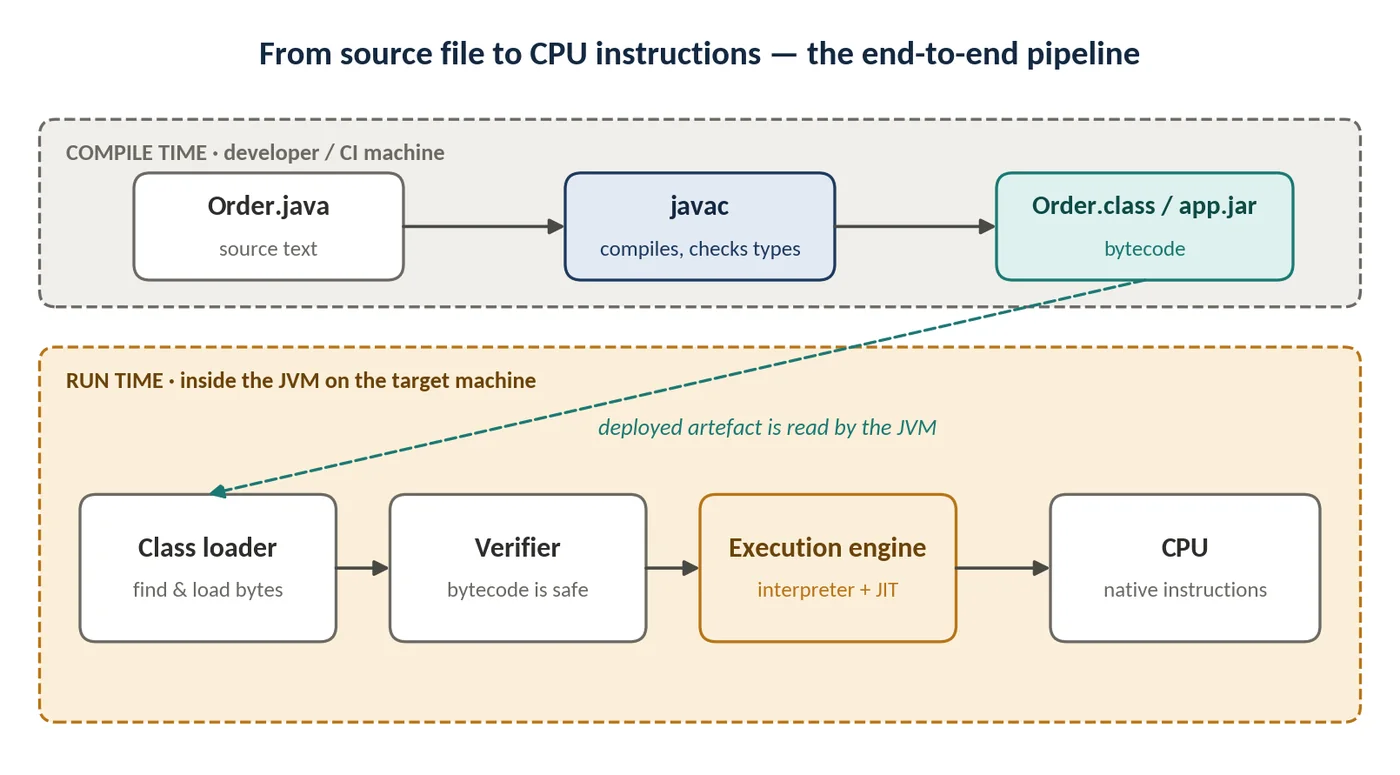
The Java source-to-execution lifecycle is the path a program takes from human-readable source code to machine instructions running on a CPU. It is split into two halves that happen at different times, usually on different machines.
- Compile time.
javacreads.javafiles, checks them against the language rules, and writes platform-neutral bytecode into.classfiles, normally packaged into a JAR. - Run time. A JVM on the target machine loads the classes it needs, verifies them, links and initialises them, then executes the bytecode — first by interpreting it, then by compiling frequently used code to native instructions with the just-in-time (JIT) compiler.
2Why It Exists
A single compilation step straight to machine code, as in C, ties the binary to one operating system and CPU. Java deliberately splits the work so that each half can do what it is best placed to do.
| Design choice | What it buys |
|---|---|
| Compile to bytecode instead of machine code | One artefact for every platform; the JVM handles the hardware |
| Verify bytecode when it is loaded | Untrusted or corrupted classes cannot break memory safety |
| Load classes lazily, on first use | Fast startup for large applications; plugins and frameworks can add classes at run time |
| Interpret first, compile later | Code starts running immediately without waiting for full compilation |
| JIT-compile with runtime profiling | Optimisations based on how the program actually behaves — which branches are taken, which types appear — which a static compiler cannot know |
3Core Concepts
.java source files
A source file is plain text containing one or more type declarations. Its structure and naming follow simple rules that javac enforces:
- At most one public top-level type per file, and the file must be named after it:
public class Orderlives inOrder.java. - The
packagedeclaration should match the directory structure:package com.shop.order;lives incom/shop/order/. Build tools and the class loader rely on this. - Source files are read as UTF-8 by default since Java 18, so the platform's default encoding no longer changes how source is compiled.
- Java 25 compact source files (JEP 512) are an exception: a file with only methods and fields, and a
void main(), is treated as an implicitly declared class. See 2.1.
Compilation with javac
javac turns source into bytecode in a series of phases. It parses text into a syntax tree, resolves names and types, checks flow rules such as definite assignment and unreachable code, lowers language features into simpler constructs, and finally writes class files.
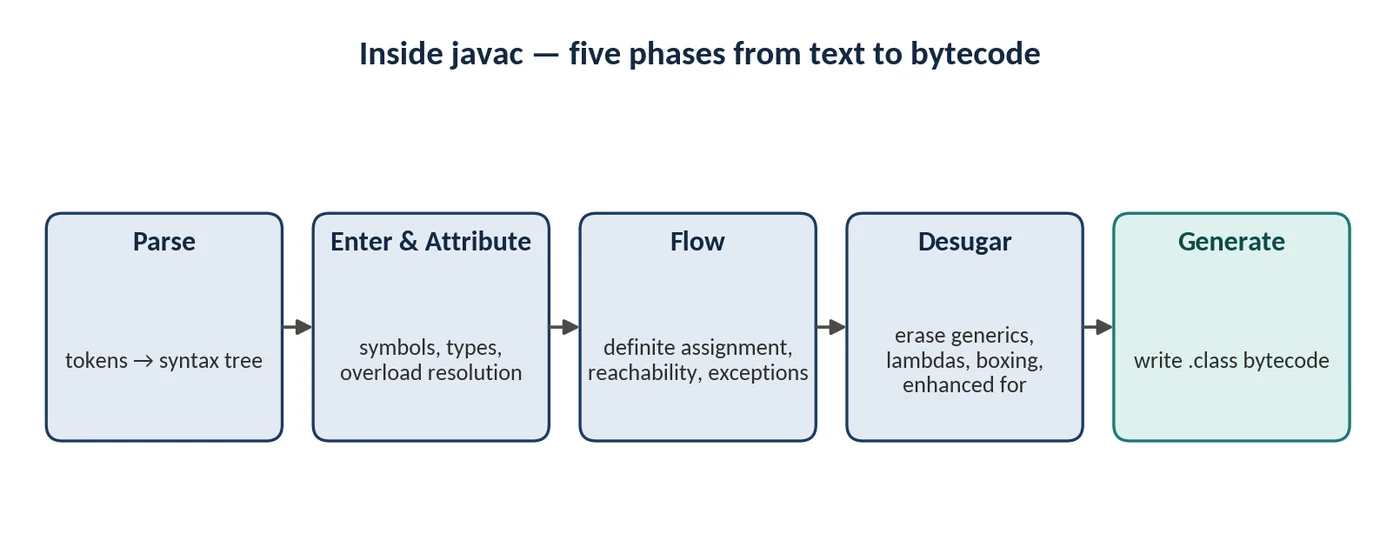
Most of the compiler's work is checking, not optimising. javac performs only simple optimisations such as folding compile-time constants; almost all performance optimisation happens later in the JIT. Several language features exist only at compile time: generic type arguments are erased, enhanced for loops become iterator or index loops, and auto-boxing becomes calls such as Integer.valueOf.
| Useful javac option | Effect |
|---|---|
| -d out | Write class files to the out directory, in package folders |
| --release 21 | Compile for an older platform: checks API usage and sets the class-file version |
| -Xlint:all | Enable all recommended warnings |
| -g | Include full debug information (local variable names) |
| -parameters | Keep method parameter names for reflection, used by some frameworks |
.class files
Each class, interface, enum and record produces its own .class file, including nested types: Order$Item.class for a nested class and Order$1.class for an anonymous class. A class file is a precisely specified binary structure defined in the JVMS.

The constant pool is the symbol table of the class: every class name, method signature, field reference and literal used by the code is stored once there and referred to by index. The major version records which Java release the class targets; a JVM refuses to load classes newer than itself.
| Java release | 8 | 11 | 17 | 21 | 25 |
|---|---|---|---|---|---|
| Class-file major version | 52 | 55 | 61 | 65 | 69 |
Bytecode
Bytecode is the instruction set of the JVM. Each instruction is one byte of opcode followed by optional operands, which gives about two hundred possible instructions. The JVM is a stack machine: instructions push values onto an operand stack, pop them to compute results, and store them into numbered local-variable slots. There are no CPU registers in the model; mapping to registers is the job of the JIT.

| Instruction family | Examples | Purpose |
|---|---|---|
| Load and store | iload, aload, istore, astore | Move values between local variables and the operand stack |
| Arithmetic and conversion | iadd, lmul, i2l, d2i | Compute and convert primitive values |
| Object creation and access | new, getfield, putfield, getstatic | Create objects and read or write fields |
| Method invocation | invokestatic, invokevirtual, invokeinterface, invokespecial, invokedynamic | Call methods; invokedynamic supports lambdas and string concatenation |
| Control flow | if_icmpge, goto, tableswitch | Branches and loops |
| Return and exceptions | ireturn, areturn, return, athrow | Leave a method normally or by exception |
Class loading
The JVM does not load an entire application at startup. It loads a class the first time the class is needed, in three phases: loading reads the bytes and creates a Class object; linking verifies the bytecode, allocates static fields with default values and resolves symbolic references; initialisation runs static initialisers and static field assignments.
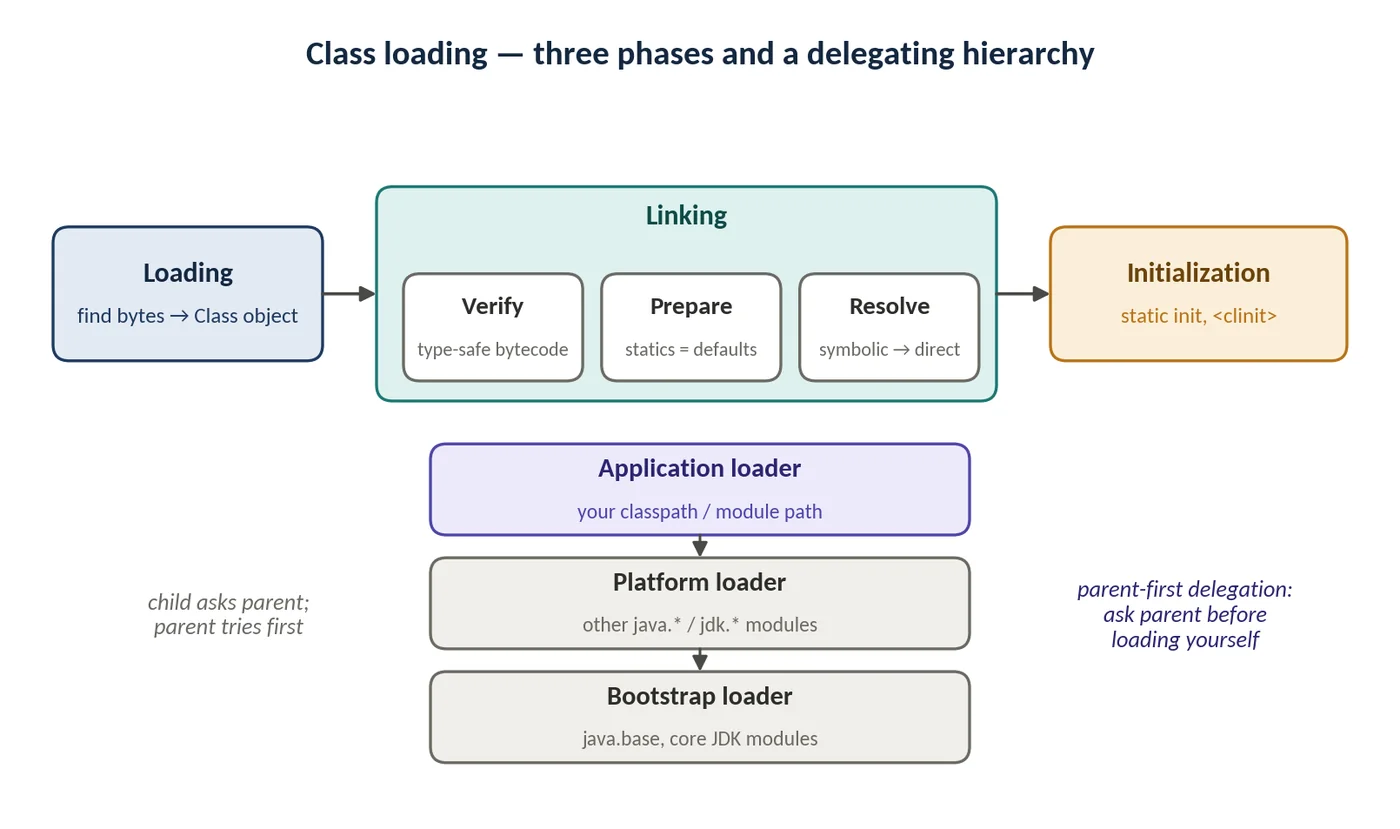
Class loaders form a hierarchy. The bootstrap loader loads the core platform modules such as java.base; the platform loader loads other Java SE and JDK modules; the application loader loads your classes from the class path or module path. Each loader first delegates to its parent, so a core class such as java.lang.String is always loaded by the bootstrap loader and cannot be replaced by an application class of the same name.
Initialisation is triggered by the first active use of a class: creating an instance, calling a static method, reading or writing a non-constant static field, initialising a subclass, reflective access, or being the main class. Merely declaring a variable of the type does not initialise the class.
JVM execution
Execution starts with the main method on the main thread. Every thread has its own stack of frames; each method call pushes a frame containing its local-variable slots and operand stack, and each return pops it. Objects live on the shared heap; class metadata lives in metaspace; compiled native code lives in the code cache.
| Runtime data area | Shared or per thread | Holds |
|---|---|---|
| Heap | Shared | All objects and arrays; managed by the garbage collector |
| JVM stack | Per thread | Frames: local variables, operand stack, return information |
| Metaspace | Shared | Class metadata, method bytecode, constant pools (native memory) |
| PC register | Per thread | Address of the current bytecode instruction |
| Native method stack | Per thread | Frames for native (C/C++) code |
| Code cache | Shared | Native code produced by the JIT |
Interpretation
When a method is first called, HotSpot runs it in the interpreter. The interpreter executes bytecode instruction by instruction using prebuilt machine-code templates, so code can start running immediately. While interpreting, it also counts method invocations and loop iterations, and records profiles: which branches are taken, which receiver types appear at call sites. These counters and profiles drive the JIT.
JIT compilation
When a method becomes "hot", HotSpot compiles it to native code. Modern HotSpot uses tiered compilation with two compilers. C1 compiles quickly with light optimisation and inserts profiling. C2 compiles the hottest code later with aggressive optimisation based on the collected profile: inlining, escape analysis, loop optimisation, dead-code elimination and speculative optimisations such as assuming only one receiver type at a call site.
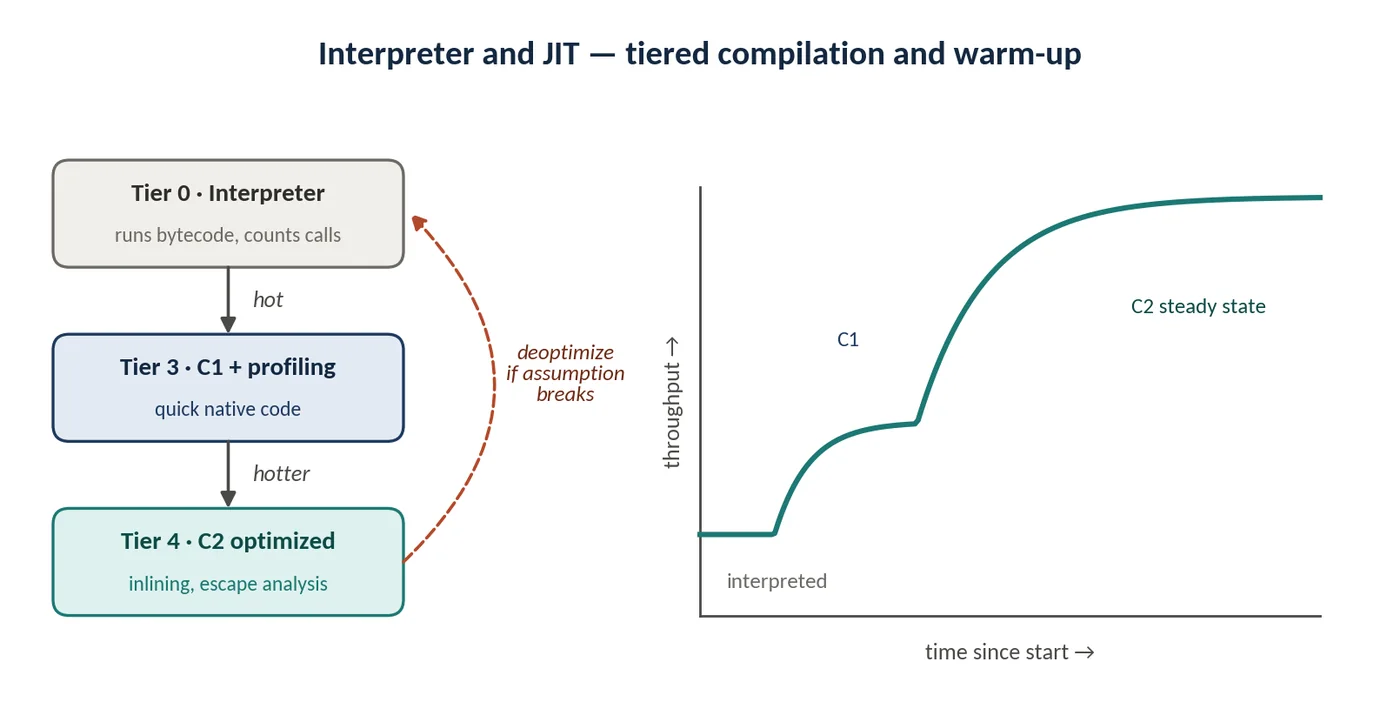
Speculative optimisations can become invalid — for example, when a new subclass is loaded and a previously single-type call site becomes polymorphic. The JVM then deoptimises: it discards the compiled code and returns to the interpreter until the method is recompiled. Long-running loops can also be switched to compiled code mid-execution through on-stack replacement (OSR).
Program lifecycle
A Java process has a clear lifecycle from the java command to the exit code returned to the operating system.
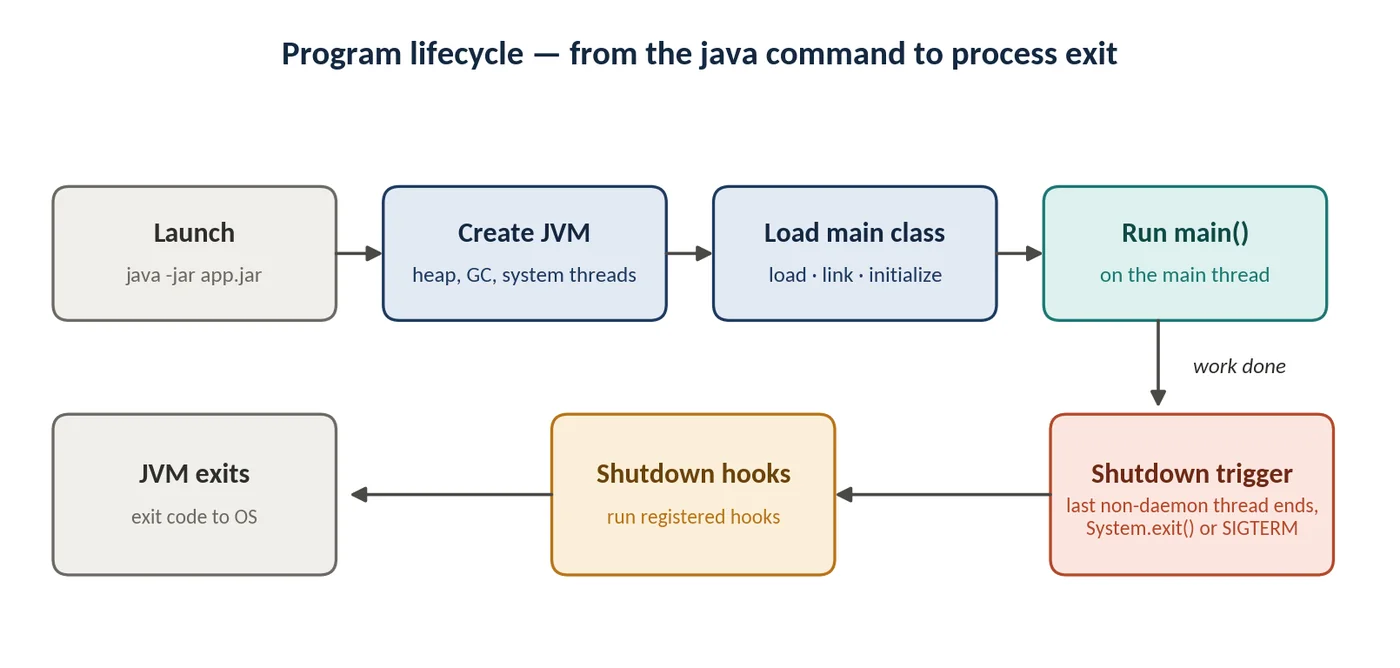
The JVM shuts down when the last non-daemon thread ends, when System.exit() is called, or when the process receives a termination signal such as SIGTERM. It then runs registered shutdown hooks and exits. A forced kill (SIGKILL, kill -9) terminates the process immediately and skips the hooks, which matters for graceful shutdown in containers.
4How It Works Internally
Following one small program end to end ties the concepts together.
package com.example;

public class Calculator {
    public static void main(String[] args) {
        int a = 10;
        int b = 20;
        int sum = a + b;
        System.out.println(sum);
    }
}javacchecks the file, resolvesSystem.outandprintln(int), and writescom/example/Calculator.classwith major version 69.java com.example.Calculatorstarts the launcher, which creates the JVM. The bootstrap loader has already loaded core classes such asString,SystemandPrintStreamfrom the modules image.- The application loader loads
Calculator, the verifier checks its bytecode, and linking prepares it. As the main class, it is initialised immediately. - The JVM invokes
mainon the main thread. The interpreter executes the bytecode below. The firstgetstaticresolves the constant-pool reference toSystem.outinto a direct reference. mainreturns, the main thread ends, no non-daemon threads remain, and the JVM shuts down with exit code 0.
public static void main(java.lang.String[]);
  Code:
     0: bipush        10
     2: istore_1
     3: bipush        20
     5: istore_2
     6: iload_1
     7: iload_2
     8: iadd
     9: istore_3
    10: getstatic     #7   // Field java/lang/System.out:Ljava/io/PrintStream;
    13: iload_3
    14: invokevirtual #13  // Method java/io/PrintStream.println:(I)V
    17: return
This program is far too short for the JIT to matter. In a real service, the same methods run millions of times: they move from interpreter to C1 to C2 within seconds or minutes, which is the warm-up curve shown in section 3.
5APIs / Features / Syntax
| Command or option | What it shows or does |
|---|---|
| javac -d out --release 25 … | Compile to a target release with correct API checks |
| javap -c -v Calculator.class | Disassemble bytecode; -v adds the constant pool and version |
| java -verbose:class … | Print every class as it is loaded |
| java -Xlog:class+load … | Unified logging of class loading, with source location |
| java -XX:+PrintCompilation … | Print methods as the JIT compiles them |
| java -Xint … | Interpreter only — for experiments, never production |
| java -XX:TieredStopAtLevel=1 … | Use only C1: faster warm-up, lower peak performance |
| jcmd <pid> Compiler.codecache | Inspect code-cache usage in a running JVM |
| Runtime.getRuntime().addShutdownHook(t) | Register work to run during normal JVM shutdown |
# Training run: exercise the application, then exit; the cache is written
$ java -XX:AOTCacheOutput=app.aot -jar app.jar

# Production runs start from the cache
$ java -XX:AOTCache=app.aot -jar app.jar6Practical Examples
Example 1 — Compile and run a packaged program
$ tree src
src
└── com/example/Calculator.java
$ javac -d out src/com/example/Calculator.java
$ tree out
out
└── com/example/Calculator.class
$ java -cp out com.example.Calculator
30
The package com.example becomes the directory com/example in both the source and output trees, and the class is run by its fully qualified name, not its file path.
Example 2 — Watch class loading
$ java -Xlog:class+load -cp out com.example.Calculator | grep -v "shared"
[0.041s][info][class,load] com.example.Calculator source: file:/home/dev/out/
30
Hundreds of JDK classes are loaded before Calculator, most of them from the class data sharing archive. Filtering them out shows the one application class and where it came from — useful when diagnosing which JAR a class was actually loaded from.
Example 3 — Lazy initialisation and the constant trap
public class InitOrder {

    static {
        System.out.println("1. InitOrder initialised (main class)");
    }

    public static void main(String[] args) {
        System.out.println("2. main starts");
        System.out.println("3. constant = " + Config.CONSTANT);
        System.out.println("4. started set = " + (Config.STARTED > 0));
    }
}

class Config {
    static final int CONSTANT = 42;                // compile-time constant
    static final long STARTED = System.nanoTime(); // computed at run time

    static {
        System.out.println("   Config initialised");
    }
}1. InitOrder initialised (main class)
2. main starts
3. constant = 42
Config initialised
4. started set = trueReading Config.CONSTANT does not initialise Config, because javac copied the constant value 42 directly into InitOrder's bytecode. Reading Config.STARTED is an active use of a non-constant field, so Config is initialised at that moment. The same rule means that changing a public constant in a library does not change callers until they are recompiled.
Example 4 — See the JIT at work
public class HotLoop {
    static long total(int n) {
        long sum = 0;
        for (int i = 0; i < n; i++) sum += i % 7;
        return sum;
    }

    public static void main(String[] args) {
        long result = 0;
        for (int round = 0; round < 20_000; round++) result += total(1_000);
        System.out.println(result);
    }
}$ java -XX:+PrintCompilation HotLoop | grep HotLoop
63 81 3 HotLoop::total (26 bytes)
66 84 % 4 HotLoop::total @ 7 (26 bytes)
67 85 4 HotLoop::total (26 bytes)
68 81 3 HotLoop::total (26 bytes) made not entrantRead the columns as time in milliseconds, compile ID, flags (% marks on-stack replacement), tier and method. total is compiled first at tier 3 (C1 with profiling), then its loop is replaced on the stack by C2 code, then the whole method is compiled at tier 4 (C2). The old tier-3 version is then "made not entrant": no new calls use it.
Example 5 — Graceful shutdown hook
public class Worker {
    public static void main(String[] args) throws InterruptedException {
        Runtime.getRuntime().addShutdownHook(Thread.ofPlatform().unstarted(() -> {
            System.out.println("Shutdown hook: flushing buffers, closing pools");
        }));
        System.out.println("Working... press Ctrl+C or send SIGTERM");
        Thread.sleep(60_000);
    }
}
Ctrl+C or SIGTERM runs the hook before the JVM exits. kill -9 does not. In Kubernetes, the container receives SIGTERM first and SIGKILL only after the grace period, so shutdown hooks — or framework shutdown callbacks built on them — must finish inside that window.
7Common Problems & Mistakes
| Problem or misconception | What is really happening | What to do |
|---|---|---|
| "Java is interpreted, so it is slow" | Hot code runs as optimised native code after warm-up | Judge performance after warm-up, or change the startup model (section 9) |
| Microbenchmark with a simple timing loop | Measures interpreter, OSR and dead-code elimination, not real performance | Use JMH, which handles warm-up, forking and dead-code effects |
| ClassNotFoundException | Code asked a loader for a class by name (Class.forName, a framework) and it was not found | Check the class path, module path and dependency packaging |
| NoClassDefFoundError | A class present at compile time is missing at run time, or its initialisation previously failed | Check packaging; look earlier in the log for ExceptionInInitializerError |
| UnsupportedClassVersionError | Class compiled for a newer release than the running JVM | Align runtime and --release target |
| Changed a public constant, callers still see the old value | Compile-time constants are inlined into callers | Recompile callers, or use a method or non-constant field for values that change |
| Critical work in shutdown hooks | Hooks are skipped on SIGKILL and must be short | Keep hooks brief; design for crash recovery (idempotency, durable state) |
| System.exit() inside library or framework code | Kills the whole JVM, including unrelated work | Throw an exception and let the application decide |
8Performance & Production Considerations
- Warm-up and autoscaling. A freshly started instance runs slower until its hot paths are compiled. If a load balancer sends full traffic to it immediately, latency spikes. Use readiness checks, gradual traffic shifting, or synthetic warm-up requests.
- Startup time. Class data sharing is on by default for JDK classes. Application CDS archives and the Java 25 AOT cache extend it to application classes and profiles, often reducing startup noticeably without code changes.
- CPU limits in containers. The JIT compiler threads compete with application threads for CPU. A container limited to one CPU warms up much more slowly than one with two or more; very small CPU limits hurt JIT-heavy services the most.
- Graceful shutdown. Configure the framework's graceful shutdown, keep the orchestrator's grace period longer than it, and never depend on hooks for data that must not be lost.
- Code cache. Very large applications can fill the code cache, after which the JIT stops compiling and performance degrades. It is rare, but visible with
jcmd Compiler.codecacheand in JVM logs.
9Architecture & Design Considerations
The lifecycle creates a trade-off between fast startup and high peak throughput. Different deployment styles value these differently, and the platform now offers several ways to shift the balance.
| Approach | Startup | Peak throughput | Fits |
|---|---|---|---|
| Standard JIT (HotSpot) | Slowest | Highest after warm-up | Long-running services, batch |
| JIT + CDS / AOT cache | Faster | Same as JIT | Most containerised services; low effort |
| GraalVM native image | Very fast (milliseconds) | Good, usually below a warmed JIT | Serverless, CLIs, rapid scale-to-zero |
| C1 only (TieredStopAtLevel=1) | Faster warm-up | Lower | Short-lived tools and jobs |
10Interview Questions & Answers
What does javac produce, and what does the JVM execute?
javac compiles each .java source file into one or more .class files, one for every top-level, nested, local or anonymous type. A class file holds platform-independent bytecode plus the constant pool, field and method descriptors, and metadata such as annotations and generic signatures. The JVM never sees the source. It loads class files on demand, verifies them, and executes the bytecode, first in the interpreter and then, for frequently used methods, as native machine code produced by the JIT compiler. This split is what lets the same compiled JAR run on any operating system and CPU that has a JVM.
What are the three phases of class loading?
Loading finds the class bytes, through the class path, module path or a custom class loader, and creates a Class object in the method area. Linking has three steps: verification checks that the bytecode is well formed and type-safe; preparation allocates static fields and sets them to default values such as 0 or null; and resolution turns symbolic references into direct references, often lazily. Initialisation then runs the static initialisers and static field assignments in textual order. It happens only on the first active use of the class, such as creating an instance, calling a static method or reading a non-constant static field.
Is Java compiled or interpreted?
It is both. javac compiles source code ahead of time into bytecode, which is not machine code. At run time the JVM starts by interpreting that bytecode, so the program can begin immediately. It profiles which methods and loops run often, then compiles them to native code with the C1 compiler and later, for the hottest code, with the optimising C2 compiler using the collected profile. After warm-up, most CPU time is spent in this compiled native code, which is why long-running Java services perform close to compiled languages. The answer interviewers look for is "compiled to bytecode, then interpreted and JIT-compiled".
What is parent-first delegation in class loading and why does it exist?
When a class loader is asked for a class, it first delegates the request to its parent, and only searches its own sources if the parent cannot find the class. The chain runs from the application loader to the platform loader and up to the bootstrap loader. This guarantees that core classes such as java.lang.String always come from the JDK, so application code cannot replace them by accident or on purpose, which protects security and consistency. It also prevents the same class being loaded twice by different loaders, which would create two incompatible Class objects. Some application servers deliberately invert the order for web applications so each application can use its own library versions.
What is the difference between ClassNotFoundException and NoClassDefFoundError?
ClassNotFoundException is a checked exception thrown when code explicitly asks for a class by name at run time, for example Class.forName or ClassLoader.loadClass, and no loader can find it. It usually means a configuration or plug-in name is wrong or a JAR is missing, and the caller can catch and handle it. NoClassDefFoundError is an Error thrown when the JVM needs a class that existed at compile time but is not available at run time, typically because a dependency is missing from the deployed package. It also appears when a class's static initialiser failed earlier: the first access throws ExceptionInInitializerError and every later access throws NoClassDefFoundError, so always look for the first error in the logs.
You changed a public static final int in a shared library, redeployed the library, and a calling service still uses the old value. Why?
A public static final field of a primitive or String type initialised with a constant expression is a compile-time constant. javac does not compile a reference to the field into the calling class; it copies the value directly into the caller's bytecode, a process called constant inlining. So the calling service still contains the old number even though the library has changed, and no error is reported. The fix is to recompile and redeploy every caller. For values that are expected to change between releases, avoid compile-time constants in shared APIs: expose them through a static method, an enum or configuration, so callers read the value at run time.
A new instance of a service shows high latency for the first minute after deployment. Explain and fix it.
The new instance is still warming up. At first its code is interpreted, classes are being loaded and initialised lazily, and the JIT compilers are busy compiling hot paths, first with C1 and then C2. If the load balancer sends full traffic immediately, requests run on slow code and compete with JIT threads for CPU. Fixes work at several levels: make the readiness probe pass only after warm-up, shift traffic gradually or use slow-start on the load balancer, send synthetic warm-up requests, give the container enough CPU for the compiler threads, and shorten startup and warm-up with application class data sharing or the Java 25 AOT cache.
Fixes: readiness checks that delay traffic until warm-up, gradual traffic shifting, synthetic warm-up requests, adequate CPU so JIT threads can work, and a CDS archive or the Java 25 AOT cache to shorten startup and warm-up.
Why are naive timing-loop benchmarks in Java misleading?
A simple loop with System.nanoTime measures a mixture of interpreted execution, on-stack replacement and compiled code, so the number depends on how long the loop ran rather than on the code being tested. The JIT may also remove work whose result is never used, through dead-code elimination, or hoist calculations out of the loop, so the benchmark can measure almost nothing. Results also vary between runs because of compilation timing, garbage collection and CPU frequency changes. JMH, the Java Microbenchmark Harness, handles these problems with warm-up iterations, multiple forked JVMs, statistical reporting and a Blackhole that consumes results so they cannot be optimised away.
What is deoptimisation?
Deoptimisation is the JVM discarding compiled code and returning execution to the interpreter. C2 makes speculative optimisations based on runtime profiles, for example assuming that an interface call site only ever sees one implementation and inlining it, or that a branch is never taken. If a later event breaks the assumption, such as a new class being loaded or an unexpected type arriving, the compiled code is no longer valid. The JVM marks it not entrant, falls back to the interpreter, gathers new profile data and recompiles. Occasional deoptimisation is normal; frequent cycles show up as unstable latency and can be seen with -XX:+PrintCompilation or JFR.
For a new service, how would you choose between the standard JIT, an AOT cache and a GraalVM native image?
Start from the scaling pattern and constraints. For long-running services, the standard JIT gives the best peak throughput, and adding a CDS or AOT cache improves startup at almost no cost. If the service scales from zero frequently or runs as a function, native image's millisecond startup and lower memory may matter more than peak throughput, but it requires build-time configuration for reflection and dynamic features and changes the profiling model. Prototype the critical path and measure startup, memory and throughput before deciding.
A platform team asks whether moving 200 Spring Boot services to native images will cut cloud costs. How do you approach the decision?
Treat it as a portfolio decision rather than one switch. Segment services by scaling pattern: scale-to-zero or bursty services benefit most from fast startup and smaller memory; steady, high-throughput services may lose peak performance and gain little.
Estimate cost from memory and instance-hour savings against build-time increase, compatibility work for reflection-heavy libraries, and changes to observability and profiling. Pilot on two or three representative services, measure, then set a policy — for example native images for event-driven functions, JIT with AOT cache for everything else — and record it as an architecture decision.
Key Takeaways
- Java is compiled twice: to bytecode by
javac, and hot code to native instructions by the JIT at run time. - Class files carry a version (Java 25 = 69), a constant pool and bytecode for a stack machine.
- Classes load lazily through a parent-first loader hierarchy: loading, linking (verify, prepare, resolve), initialisation.
- Interpretation gives instant start; tiered C1/C2 compilation gives peak speed after warm-up; deoptimisation keeps speculation safe.
- Startup versus peak throughput is an architectural trade-off: CDS/AOT cache, native image or standard JIT, chosen by scaling pattern.
Coverage checklist
.java source files ✔ · Compilation with javac ✔ · .class files ✔ · Bytecode ✔ · Class loading ✔ · JVM execution ✔ · Interpretation ✔ · JIT compilation ✔ · Program lifecycle ✔